

In this post, I’ll focus on setups that I’m monitoring for both long and short positions. With a chart and short write-up, this is a quick way to scan and plan potential trades.
These ideas are the end result of my process to identify stocks offering the right combination of growth fundamentals along with a proper chart setup.
Stock Market Update
The most recent report on consumer inflation shows that core measures are continuing to accelerate. The headline Consumer Price Index (CPI) increased by 2.7% compared to last year, which was in line with estimates and matched June’s pace. But the core figure that excludes food and energy prices rose by 3.1% which was slightly higher than estimates. That also marks the second consecutive month where the core measure is seeing a faster rate of change. Annualized figures of more recent lookback periods are rising faster as well as you can see in the chart below. I’ve been highlighting that leading indicators of inflation point to rising price levels in the months ahead. The latest warning comes from the “supercore” figure that looks at core services excluding shelter, which gained by 0.48% month-over-month in July and was the biggest monthly gain in six months.

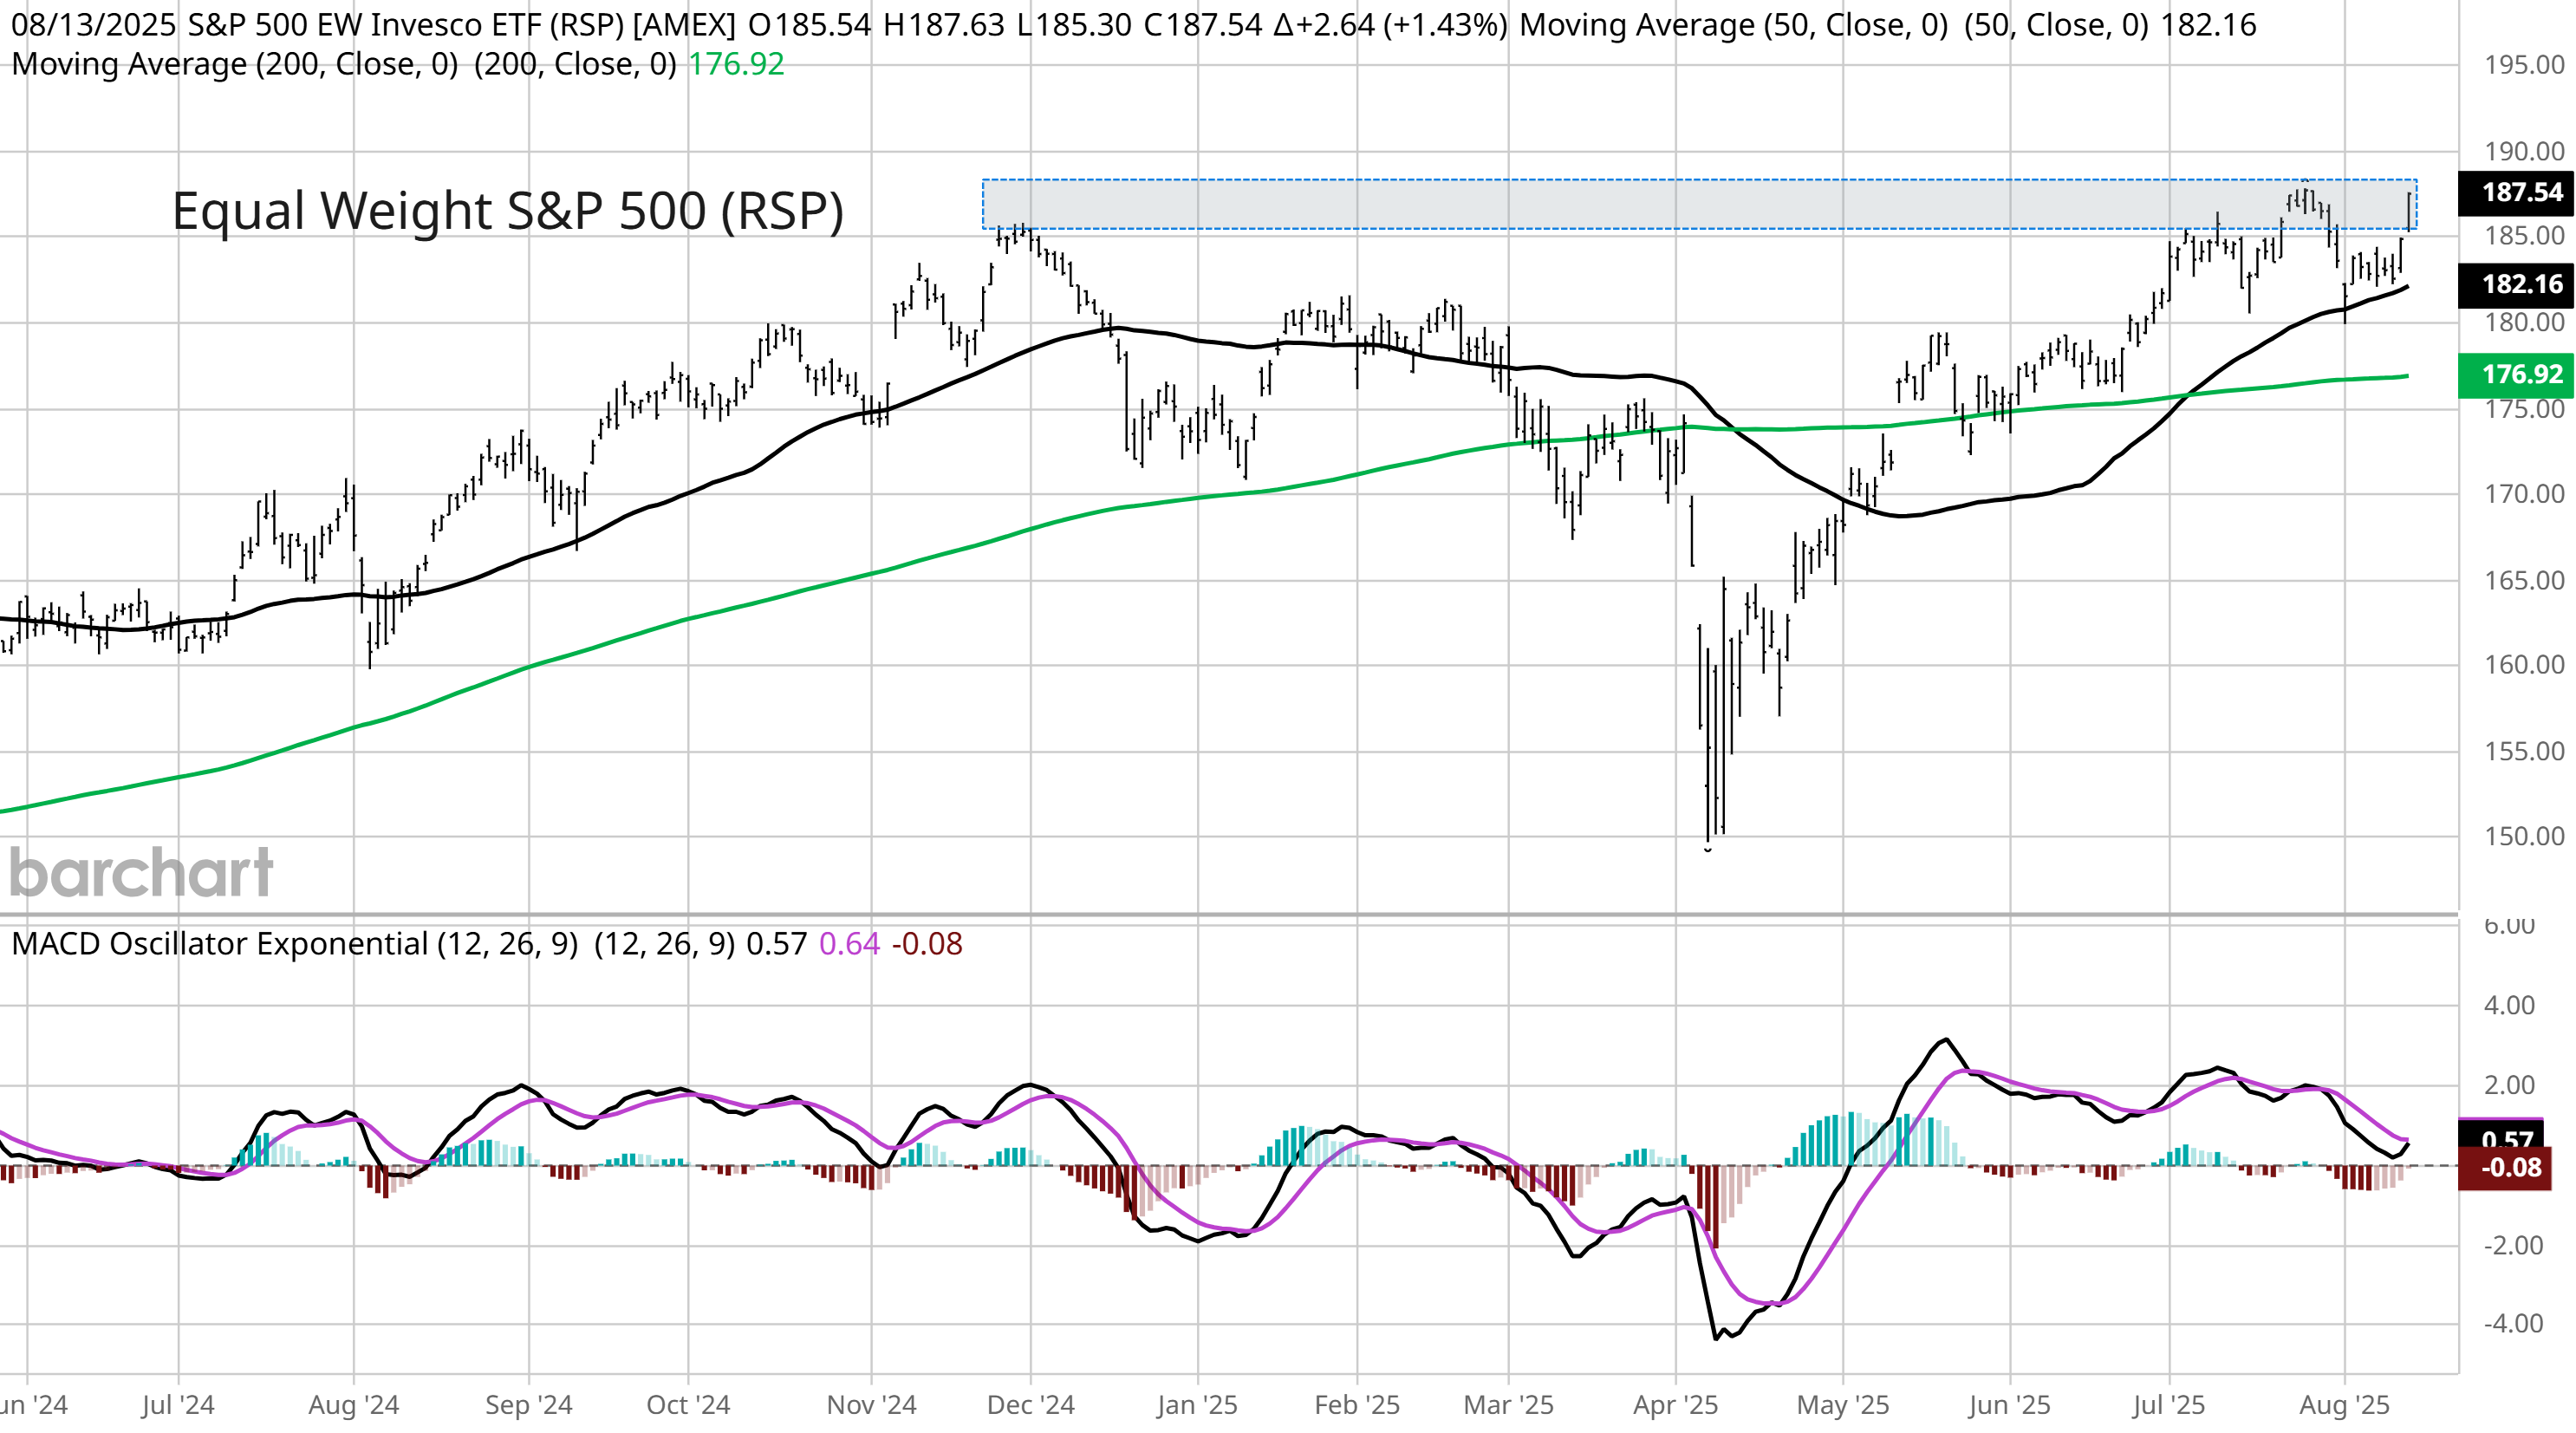
Despite evidence that core inflation is picking up, stocks went on a huge run following the CPI data. The upside surprise with inflation wasn’t enough to derail hopes that a September interest rate cut from the Federal Reserve is on the table, with market odds currently favoring a 94% chance of a cut. I’ve also argued recently that the underlying strength of the economy is much better than feared following the weak July payrolls report. The combination of prospective falling short-term rates and an economic outlook that remains intact is fueling the average stock. The NYSE advance/decline ratio hit nearly 6 to 1 following the post-CPI rally, which is one of the strongest figures since the April lows. Small-caps are surging higher and have added nearly 5% in just two days. The next major breakout to monitor is with the average stock in the S&P 500. The Invesco S&P 500 Equal Weight ETF (RSP) is rallying off the 50-day moving average and close to making a new high (chart below).
This remains an constructive trading environment despite typical post-election year seasonality becoming more of a headwind over the next two months. While you can expect pullbacks along the way, the combination of rising global liquidity, prospect of rate cuts, and positive earnings outlook can drive the stock market rally into year-end. We’re recently taking profits on a few positions, but there are plenty more high-growth stocks trading in breakout setups. Keep reading to see:
Open ETF positions.
Open stock positions.
Chart analysis for new trade ideas.
