

In this post, I’ll focus on setups that I’m monitoring for both long and short positions. With a chart and short write-up, this is a quick way to scan and plan potential trades.
These ideas are the end result of my process to identify stocks offering the right combination of growth fundamentals along with a proper chart setup.
Stock Market Update
A pair of updated inflation reports are delivering a mixed picture on price pressures facing the economy. The Consumer Price Index (CPI) rose by 2.7% in December compared to last year, which matched expectations and the prior month’s reading. The CPI has shown deceleration from the 3.0% level seen in September. But the Producer Price Index (PPI) for the month of November was reported at a 3.0% year-over-year gain which is an acceleration from the prior month and ahead of estimates for an increase of 2.7%. With PPI tending to lead changes in consumer inflation, it’s also worth noting that the Federal Reserve’s most recent Beige Book contained anecdotal comments suggesting that some businesses are now beginning to pass on tariff-related costs to customers as pre-tariff inventories run out.
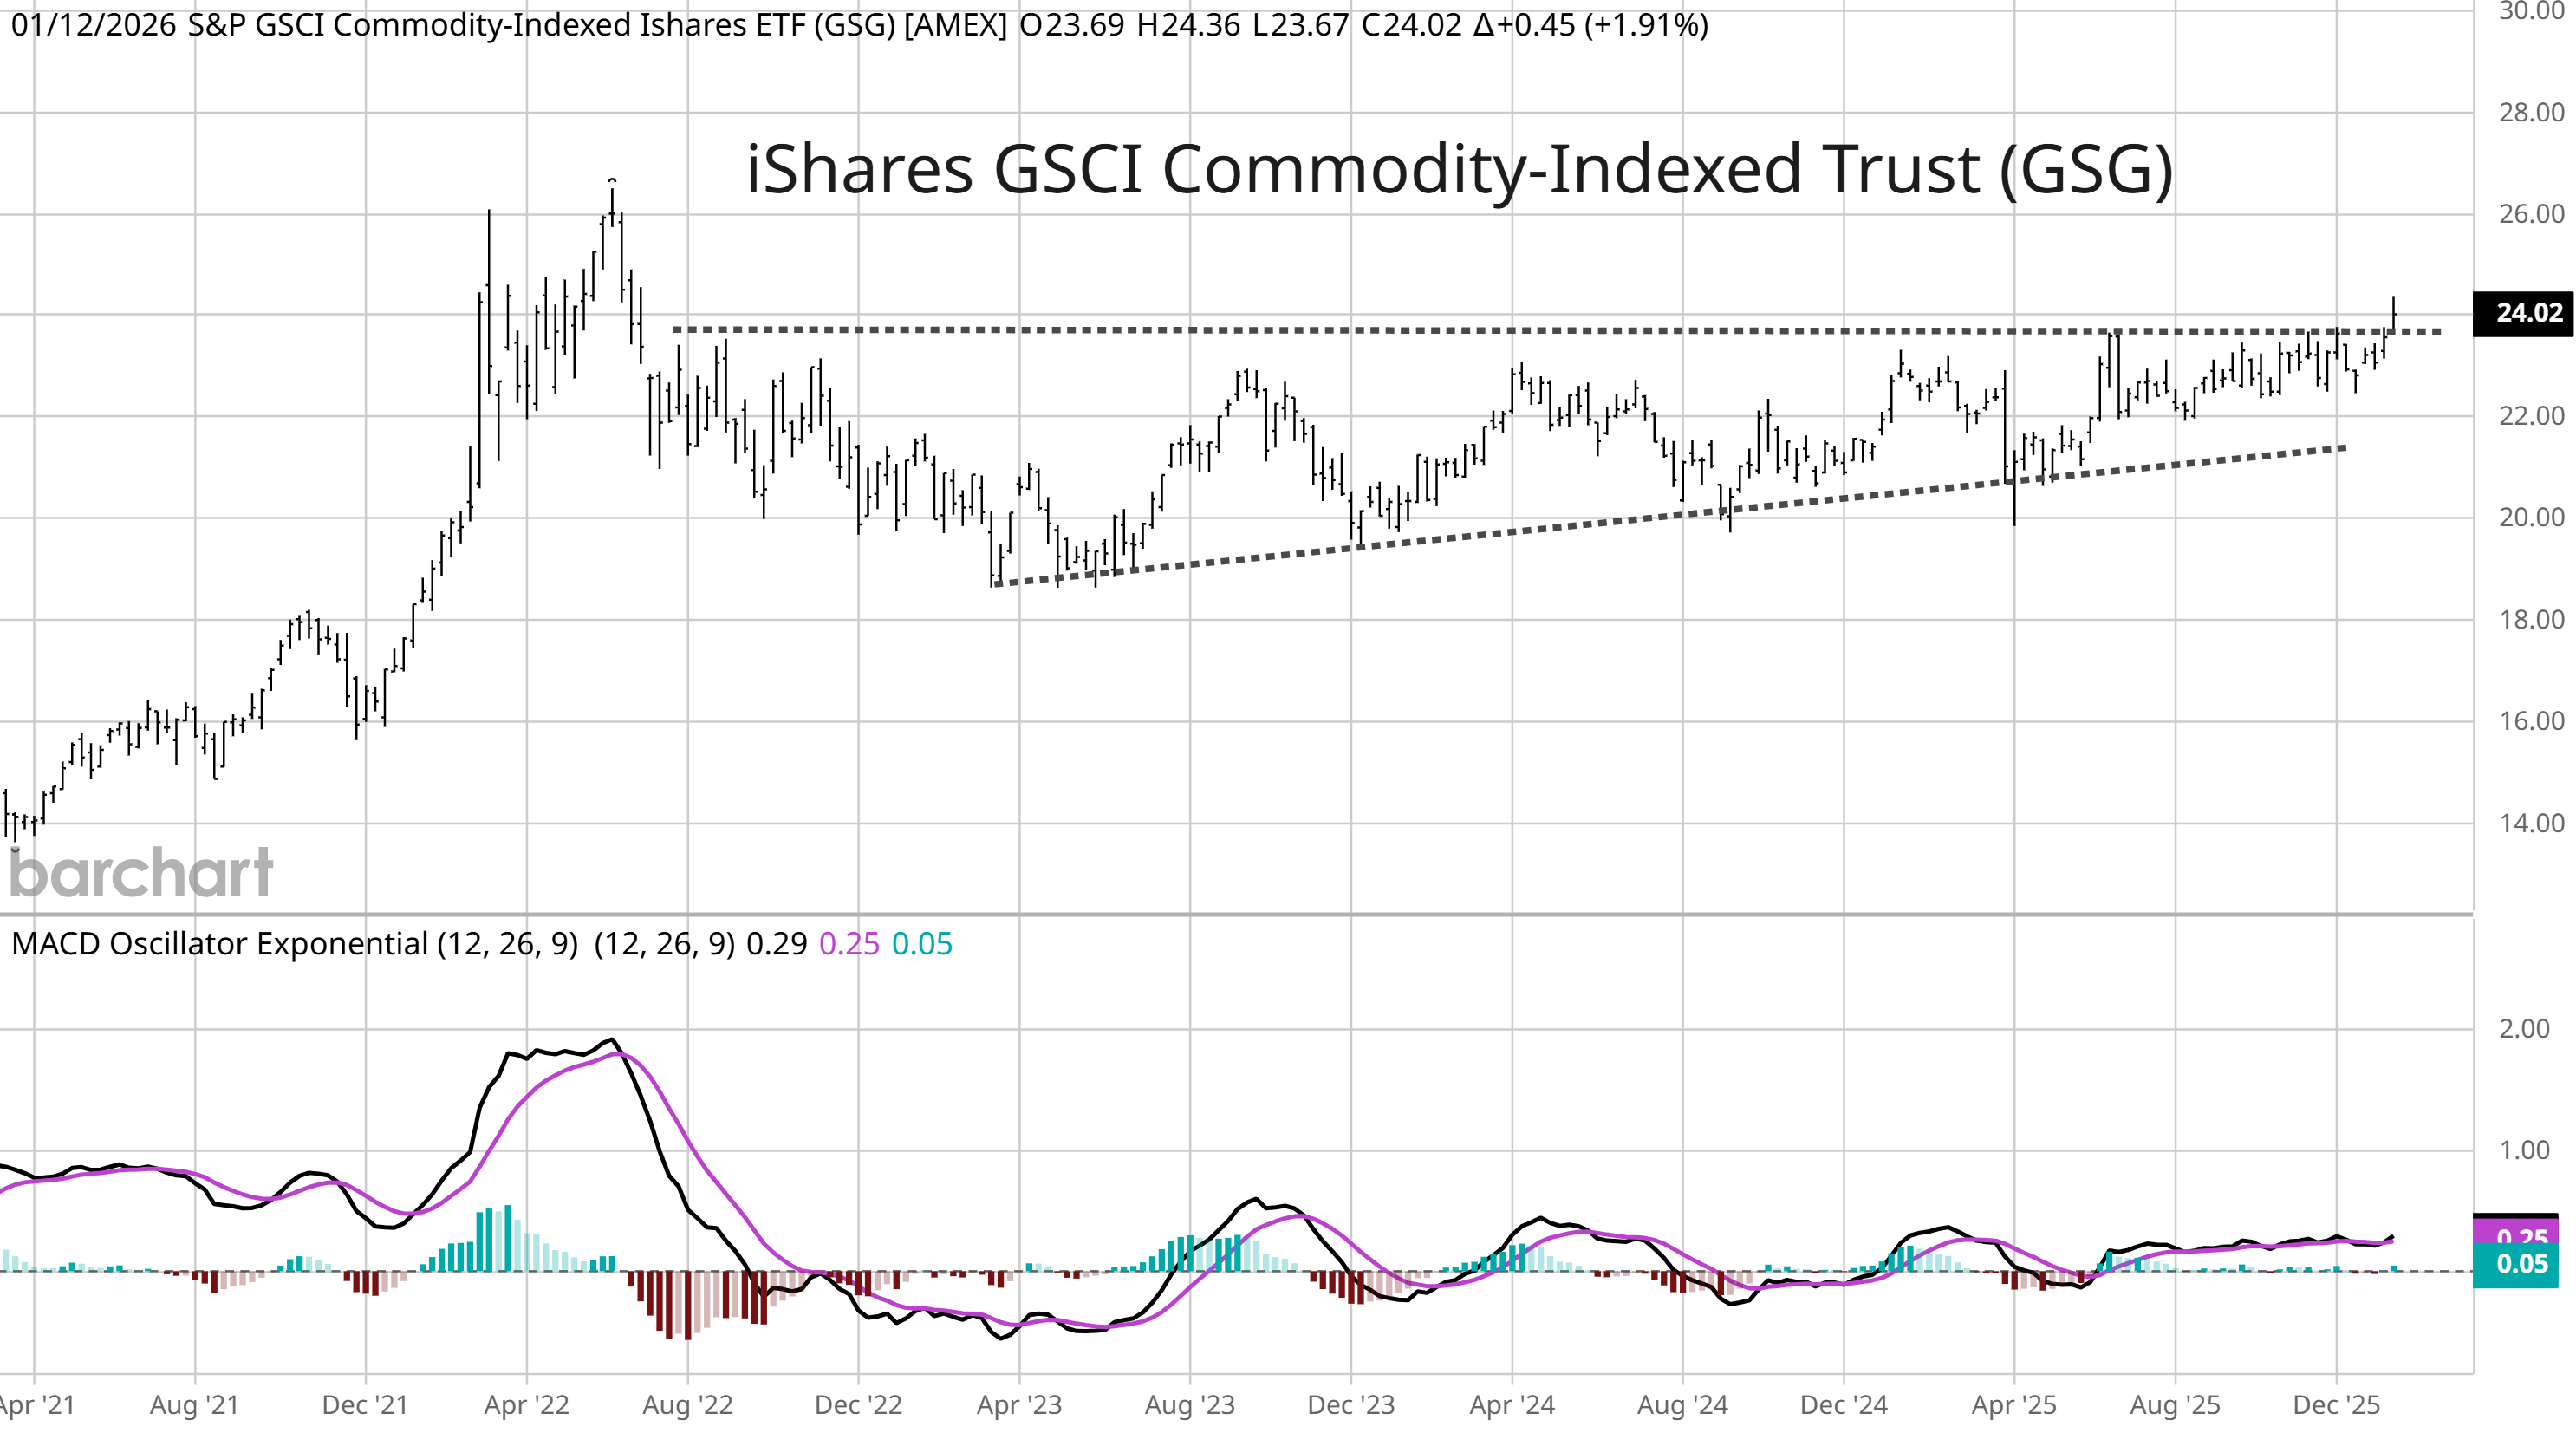
While consumer and producer inflation gauges are mixed at the end of 2025, it’s hard not to see price pressures pick up in 2026. Evidence suggests that tariffs are starting to be passed on, while the surge in base metals like copper are highly correlated to long-term inflation expectations. Another key development on the inflation front could be in the works, and that’s with a breakout in broader commodity indexes. The iShares S&P GSCI Commodity-Indexed Trust ETF (GSG) tracks a basket of commodities, and is starting to breakout from a multi-year basing pattern stretching back to 2022 that you can see in the chart below. Note that the last inflation wave that peaked in mid-2022 was accompanied by a large rally in commodities.
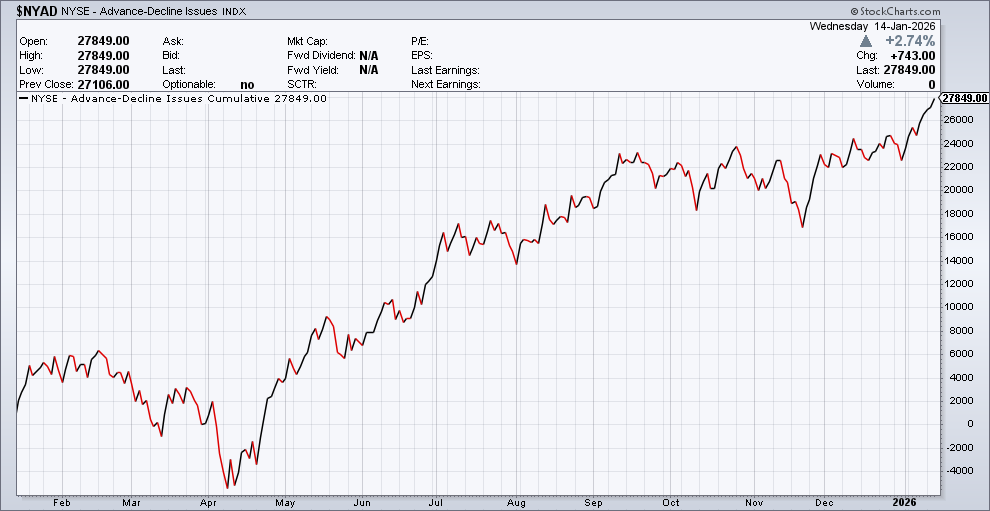
While precious metals and various other commodities are rallying to start the year, another feature of recent market action is expanding breadth. While the major indexes like the S&P 500 and Nasdaq are struggling for traction as mega-cap AI stocks trade weaker, the average stock continues making new all-time highs. The cumulative NYSE advance/decline line in the chart below is one way to track the performance of the average stock, and continues making record highs following a breakout from a basing period that lasted from September into the start of the new year.
We continue to see good setups developing, including high growth themes where recent smaller pullbacks are helping many setups. We also continue trailing our positions in precious metals and related mining stocks following the jump in gold and silver. Keep reading to see:
Open ETF positions.
Open stock positions.
Chart analysis for new trade ideas.
