In this post, I’ll focus on setups that I’m monitoring for both long and short positions. With a chart and short write-up, this is a quick way to scan and plan potential trades.
These ideas are the end result of my process to identify stocks offering the right combination of growth fundamentals along with a proper chart setup.
You can sign up for a 7-day free trial here to unlock the trade ideas in this report.
Stock Market Update
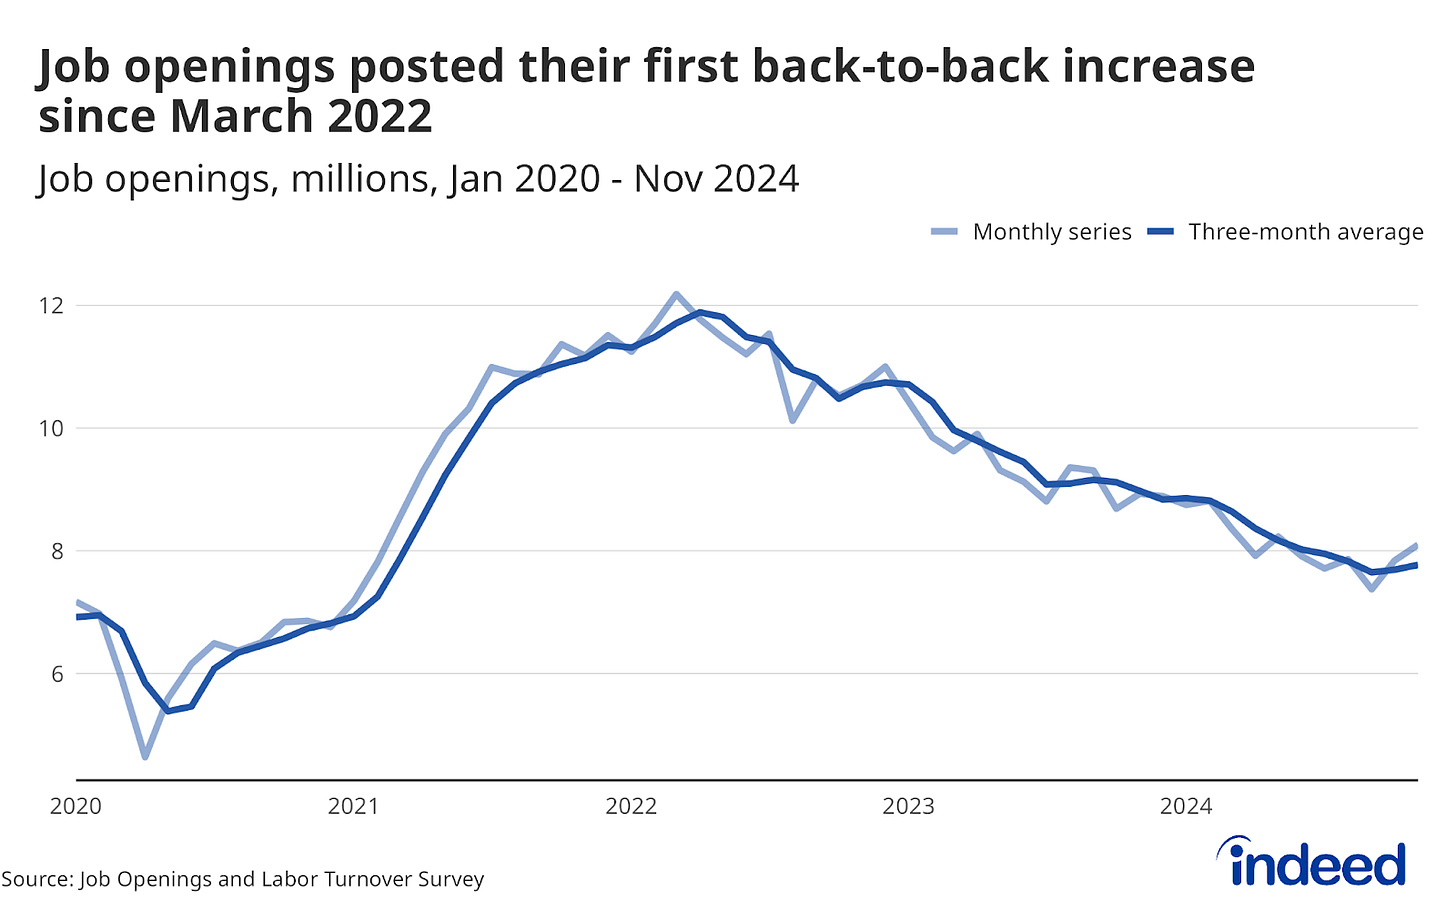
Evidence of an improving labor market and increasing pricing pressures are clouding the outlook for monetary policy and further interest rate cuts by the Federal Reserve. This week saw an updated Job Openings and Labor Turnover Survey (JOLTS) report for November. Job openings rose to 8.1 million which was better than expected and is the first back-to-back monthly gain since March 2022 (chart below). That sets up a highly anticipated payrolls report on Friday. Current estimates are for 155,000 jobs created during the month of December with the unemployment rate holding steady at 4.0%.
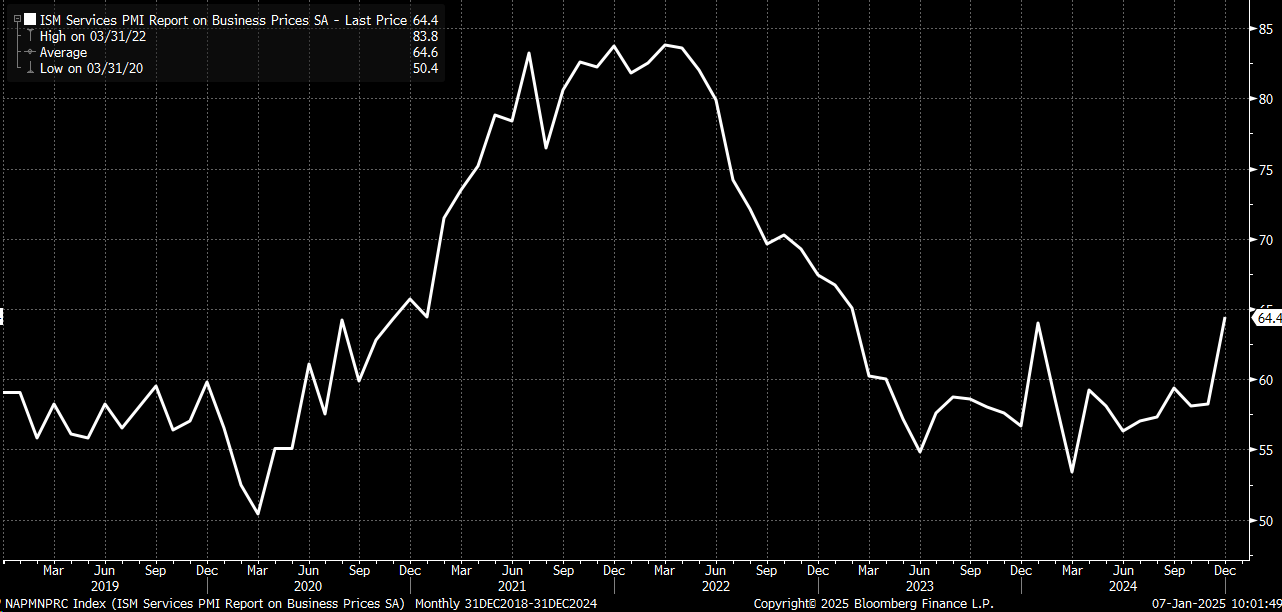
At the same time, a recent report on service sector activity from the ISM saw the prices paid component jump to the highest level since early 2023 (chart below). That adds more evidence that inflationary pressures are building. The Fed’s minutes from their last rate-setting meeting were released this week as well, and noted that nearly all participants saw upside risks to the inflation outlook. Current market-implied odds shows just one additional quarter point rate cut for all of 2025.
The evolving outlook for interest rates and inflation is weighing on the market. While the average stock is recently showing some signs of improvement after a dismal December, the weakness caught up with the major indexes. The chart below shows the S&P 500. After the large single-day drop following the Fed’s December meeting, the index is chopping around the 50-day moving average (MA - black line). At the same time, price is coiling in triangle pattern which gives us levels to watch for a break in either direction. The RSI in the bottom panel is showing similar action, and appears to making slightly higher lows as the S&P tests the 5850 area.
Another expansion this week in net new 52-week lows shows that this is still a difficult environment for trading breakouts. But there are signs that the average stock is holding up better than the indexes over the past week while the S&P 500 is making a positive momentum divergence noted above. Price confirmation along with a boost in breadth such as the NYSE advance/decline ratio are signs to watch for the rally to resume. Keep reading below to see:
Open ETF positions.
Open stock positions.
Chart analysis for new trade ideas.


