

In this post, I’ll focus on setups that I’m monitoring for both long and short positions. With a chart and short write-up, this is a quick way to scan and plan potential trades.
These ideas are the end result of my process to identify stocks offering the right combination of growth fundamentals along with a proper chart setup. Live alerts are sent to Traders Hub members only.
Stock Market Update
The S&P 500 just posted its worst quarter since 2022, with a drawdown hitting both equity and bond markets to start the year. But a combination of oversold conditions and bearish positioning helped spark a rally that could be boosted by a positive feedback loop. The catalyst for the rally came from comments by President Trump that an end to the war with Iran was within sight, while negotiations with Iran at least appear to be materializing. That was enough to spark a sharp rebound in equities, especially given that a key category of institutional investors had pushed bearish positioning to extremes seen around episodes like last year’s trade war and the depths of the pandemic selloff (chart below). Moderating volatility levels and improving momentum could continue helping draw institutional fund flows back into the market.

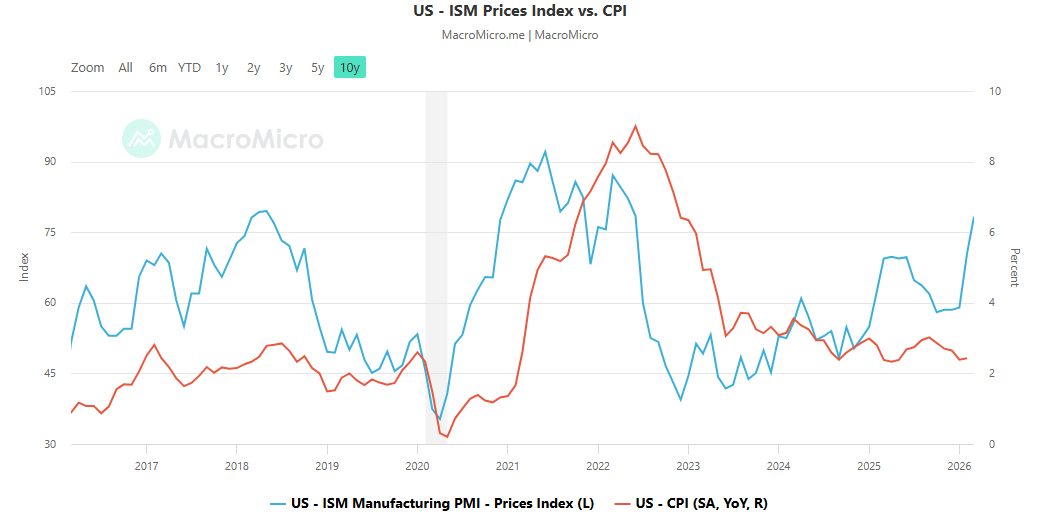
With oversold breadth and bearish sentiment reflected in both positioning and survey data, it’s no surprise to see at least a relief rally take hold. It’s also worth remembering that a period of positive seasonality runs through the end of April for the S&P 500. But a longer-term recovery in the stock market will come down to the rate outlook on both the short- and long-end of the yield curve. Based on comments from Federal Reserve Chair Jerome Powell and market-implied odds, the Fed looks set to keep rates on hold for now while the 30-year Treasury yield hovers near the highest level since 2007. Challenges on the inflation outlook still poses a major risk, especially with the prices paid component of the ISM’s most recent manufacturing survey hitting the highest level since June 2022. Back then, the Consumer Price Index surged to an annual increase of 9%. The chart below overlays the prices paid component (blue line) with CPI (red line).
While short covering and positive seasonals could help push the rally further over the near-term, the outlook for rising inflation poses a serious risk to the rate outlook and market valuations. There are still sectors and industries showing relative strength, which is where we want to focus our attention for new trades. Keep reading to see:
Open ETF positions.
Open stock positions.
Chart analysis for new trade ideas.
