

In this post, I’ll focus on setups that I’m monitoring for both long and short positions. With a chart and short write-up, this is a quick way to scan and plan potential trades.
These ideas are the end result of my process to identify stocks offering the right combination of growth fundamentals along with a proper chart setup. Live alerts are sent to Traders Hub members only.
Stock Market Update
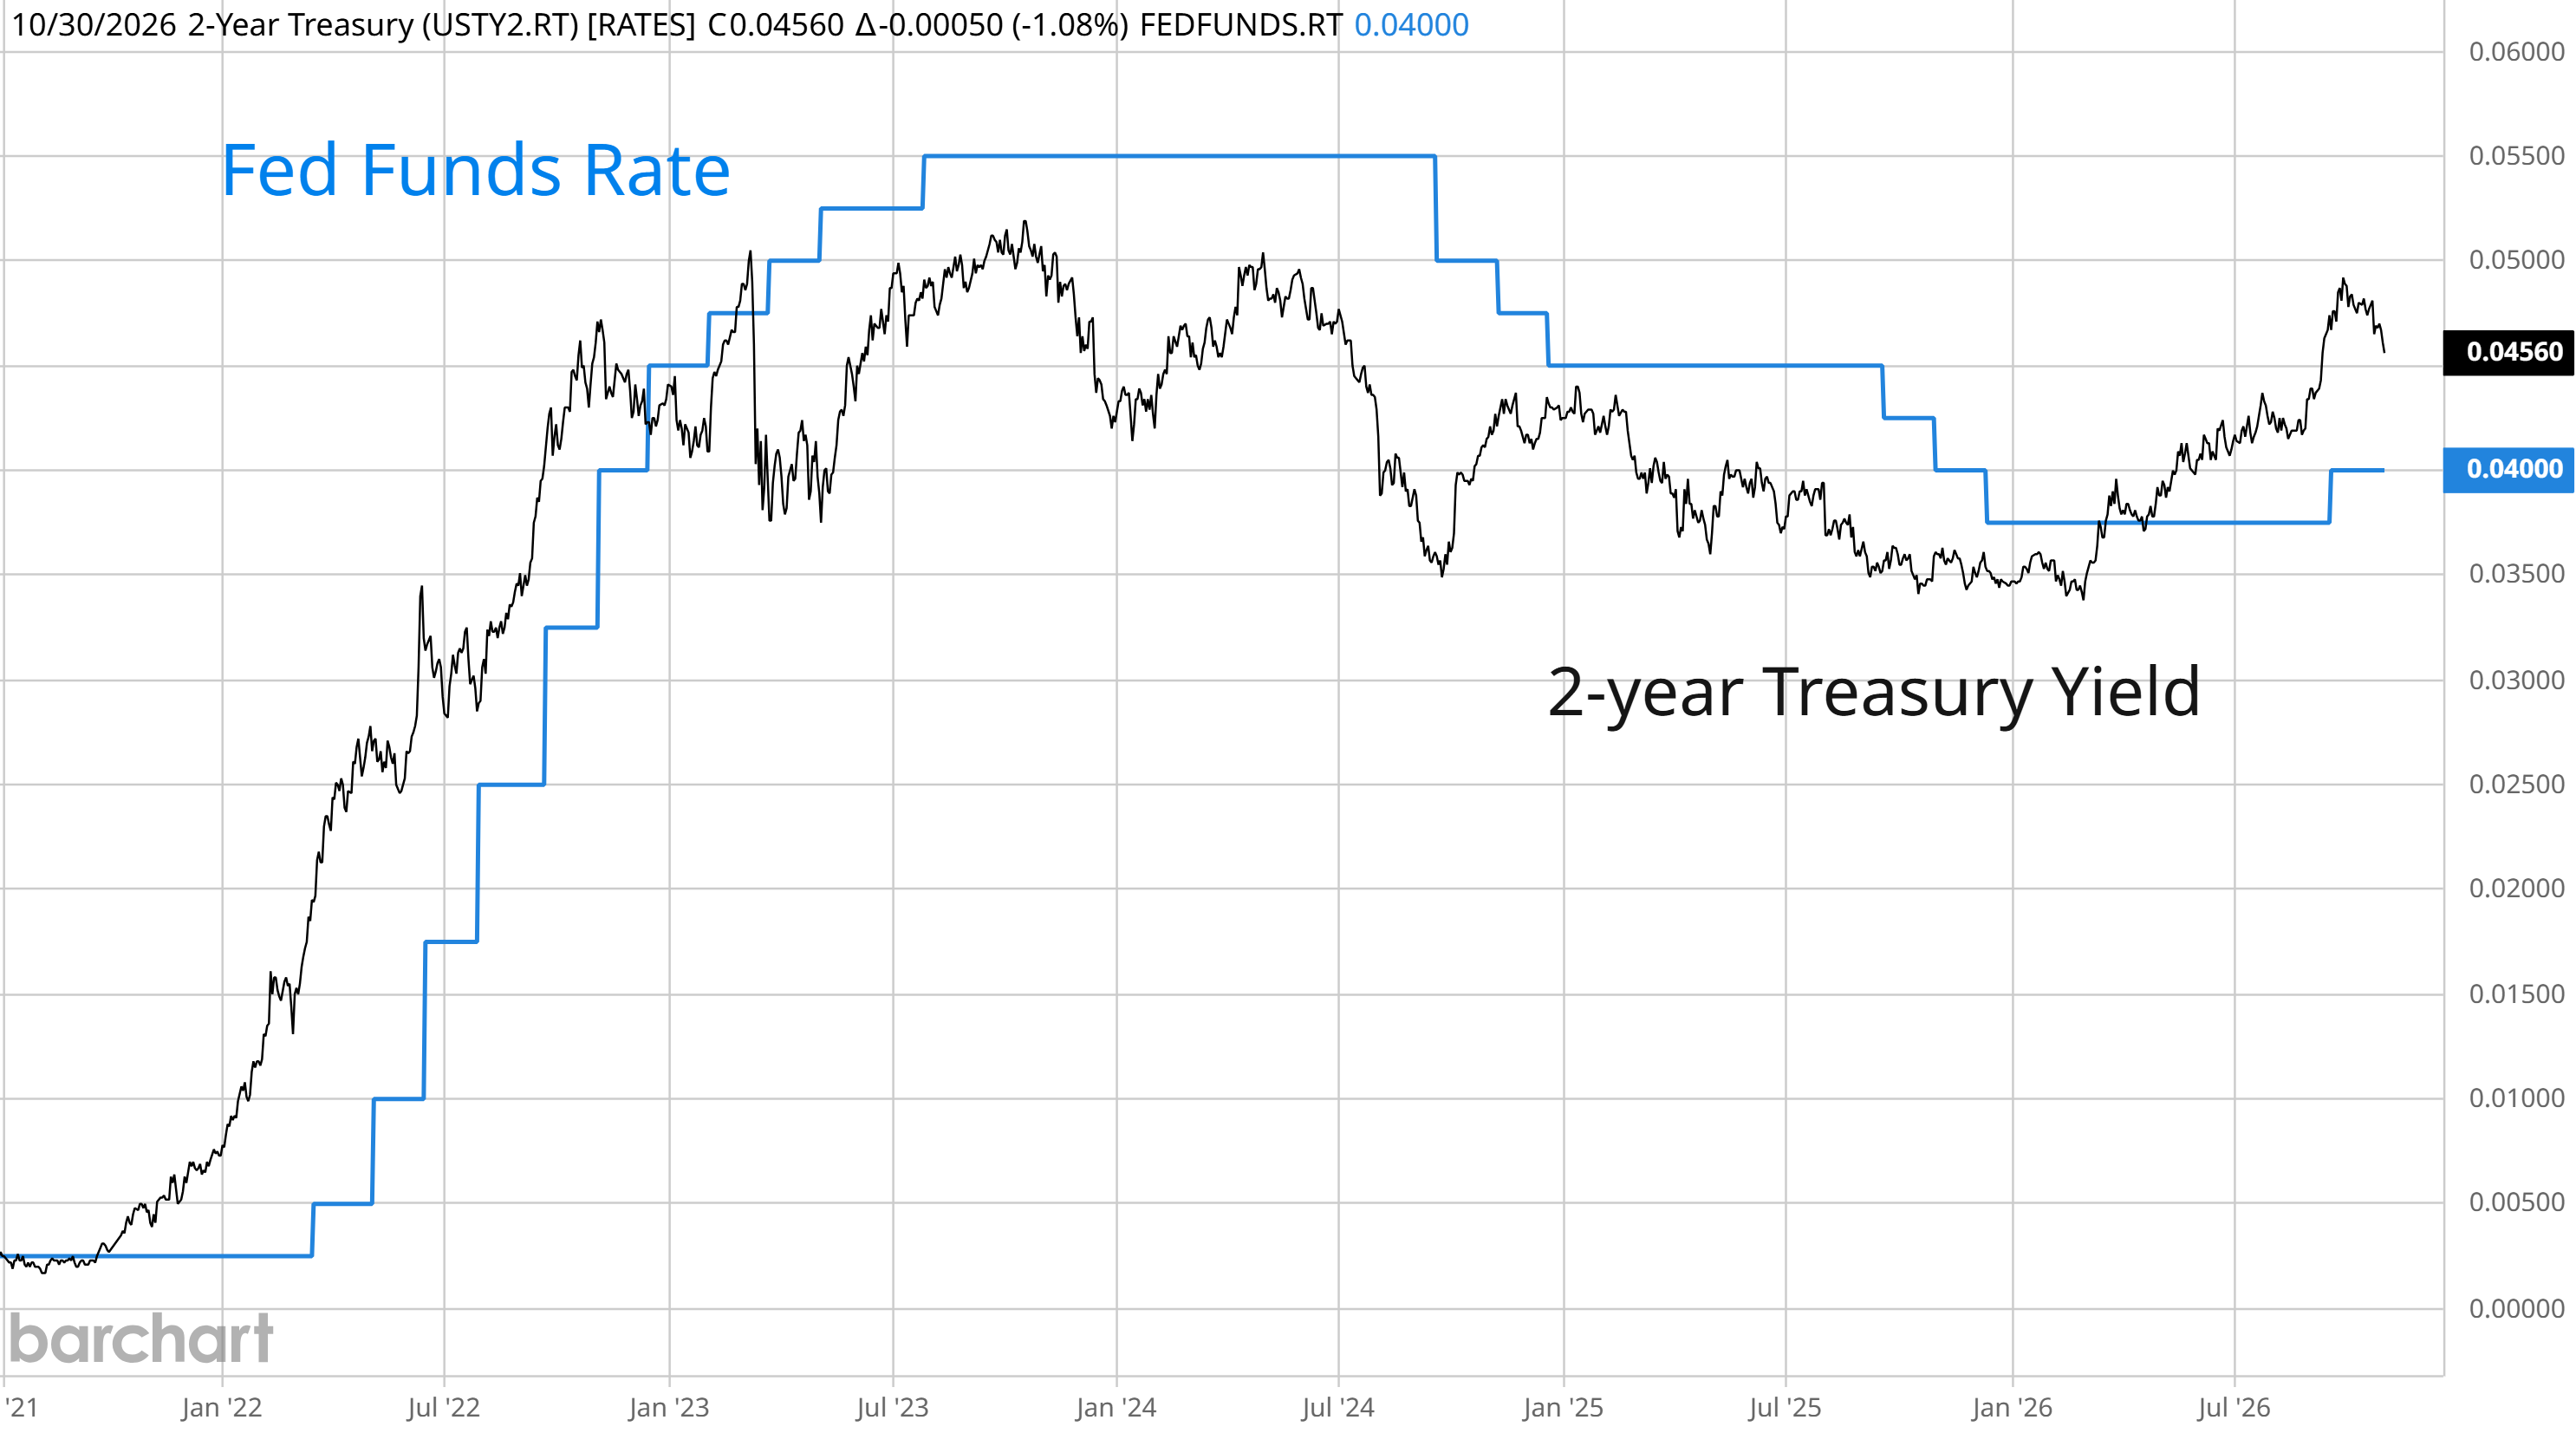
Despite few surprises from the latest rate-setting meeting by the Federal Reserve, the AI trade continues to implode. The Fed held rates steady as widely expected last week, but there’s been a dovish shift in projected rate hikes following the meeting and press conference by Fed Chair Kevin Warsh. Despite continuing tough rhetoric on restoring price stability from persistently high inflation, market-implied odds now show just two rate hikes through the end of next year compared to three hikes before the meeting. The 2-year Treasury yield that tends to lead changes in the fed funds rate is pulling back and is currently 56 basis points above the Fed’s upper target (chart below), implying about two quarter-point rate hikes ahead.
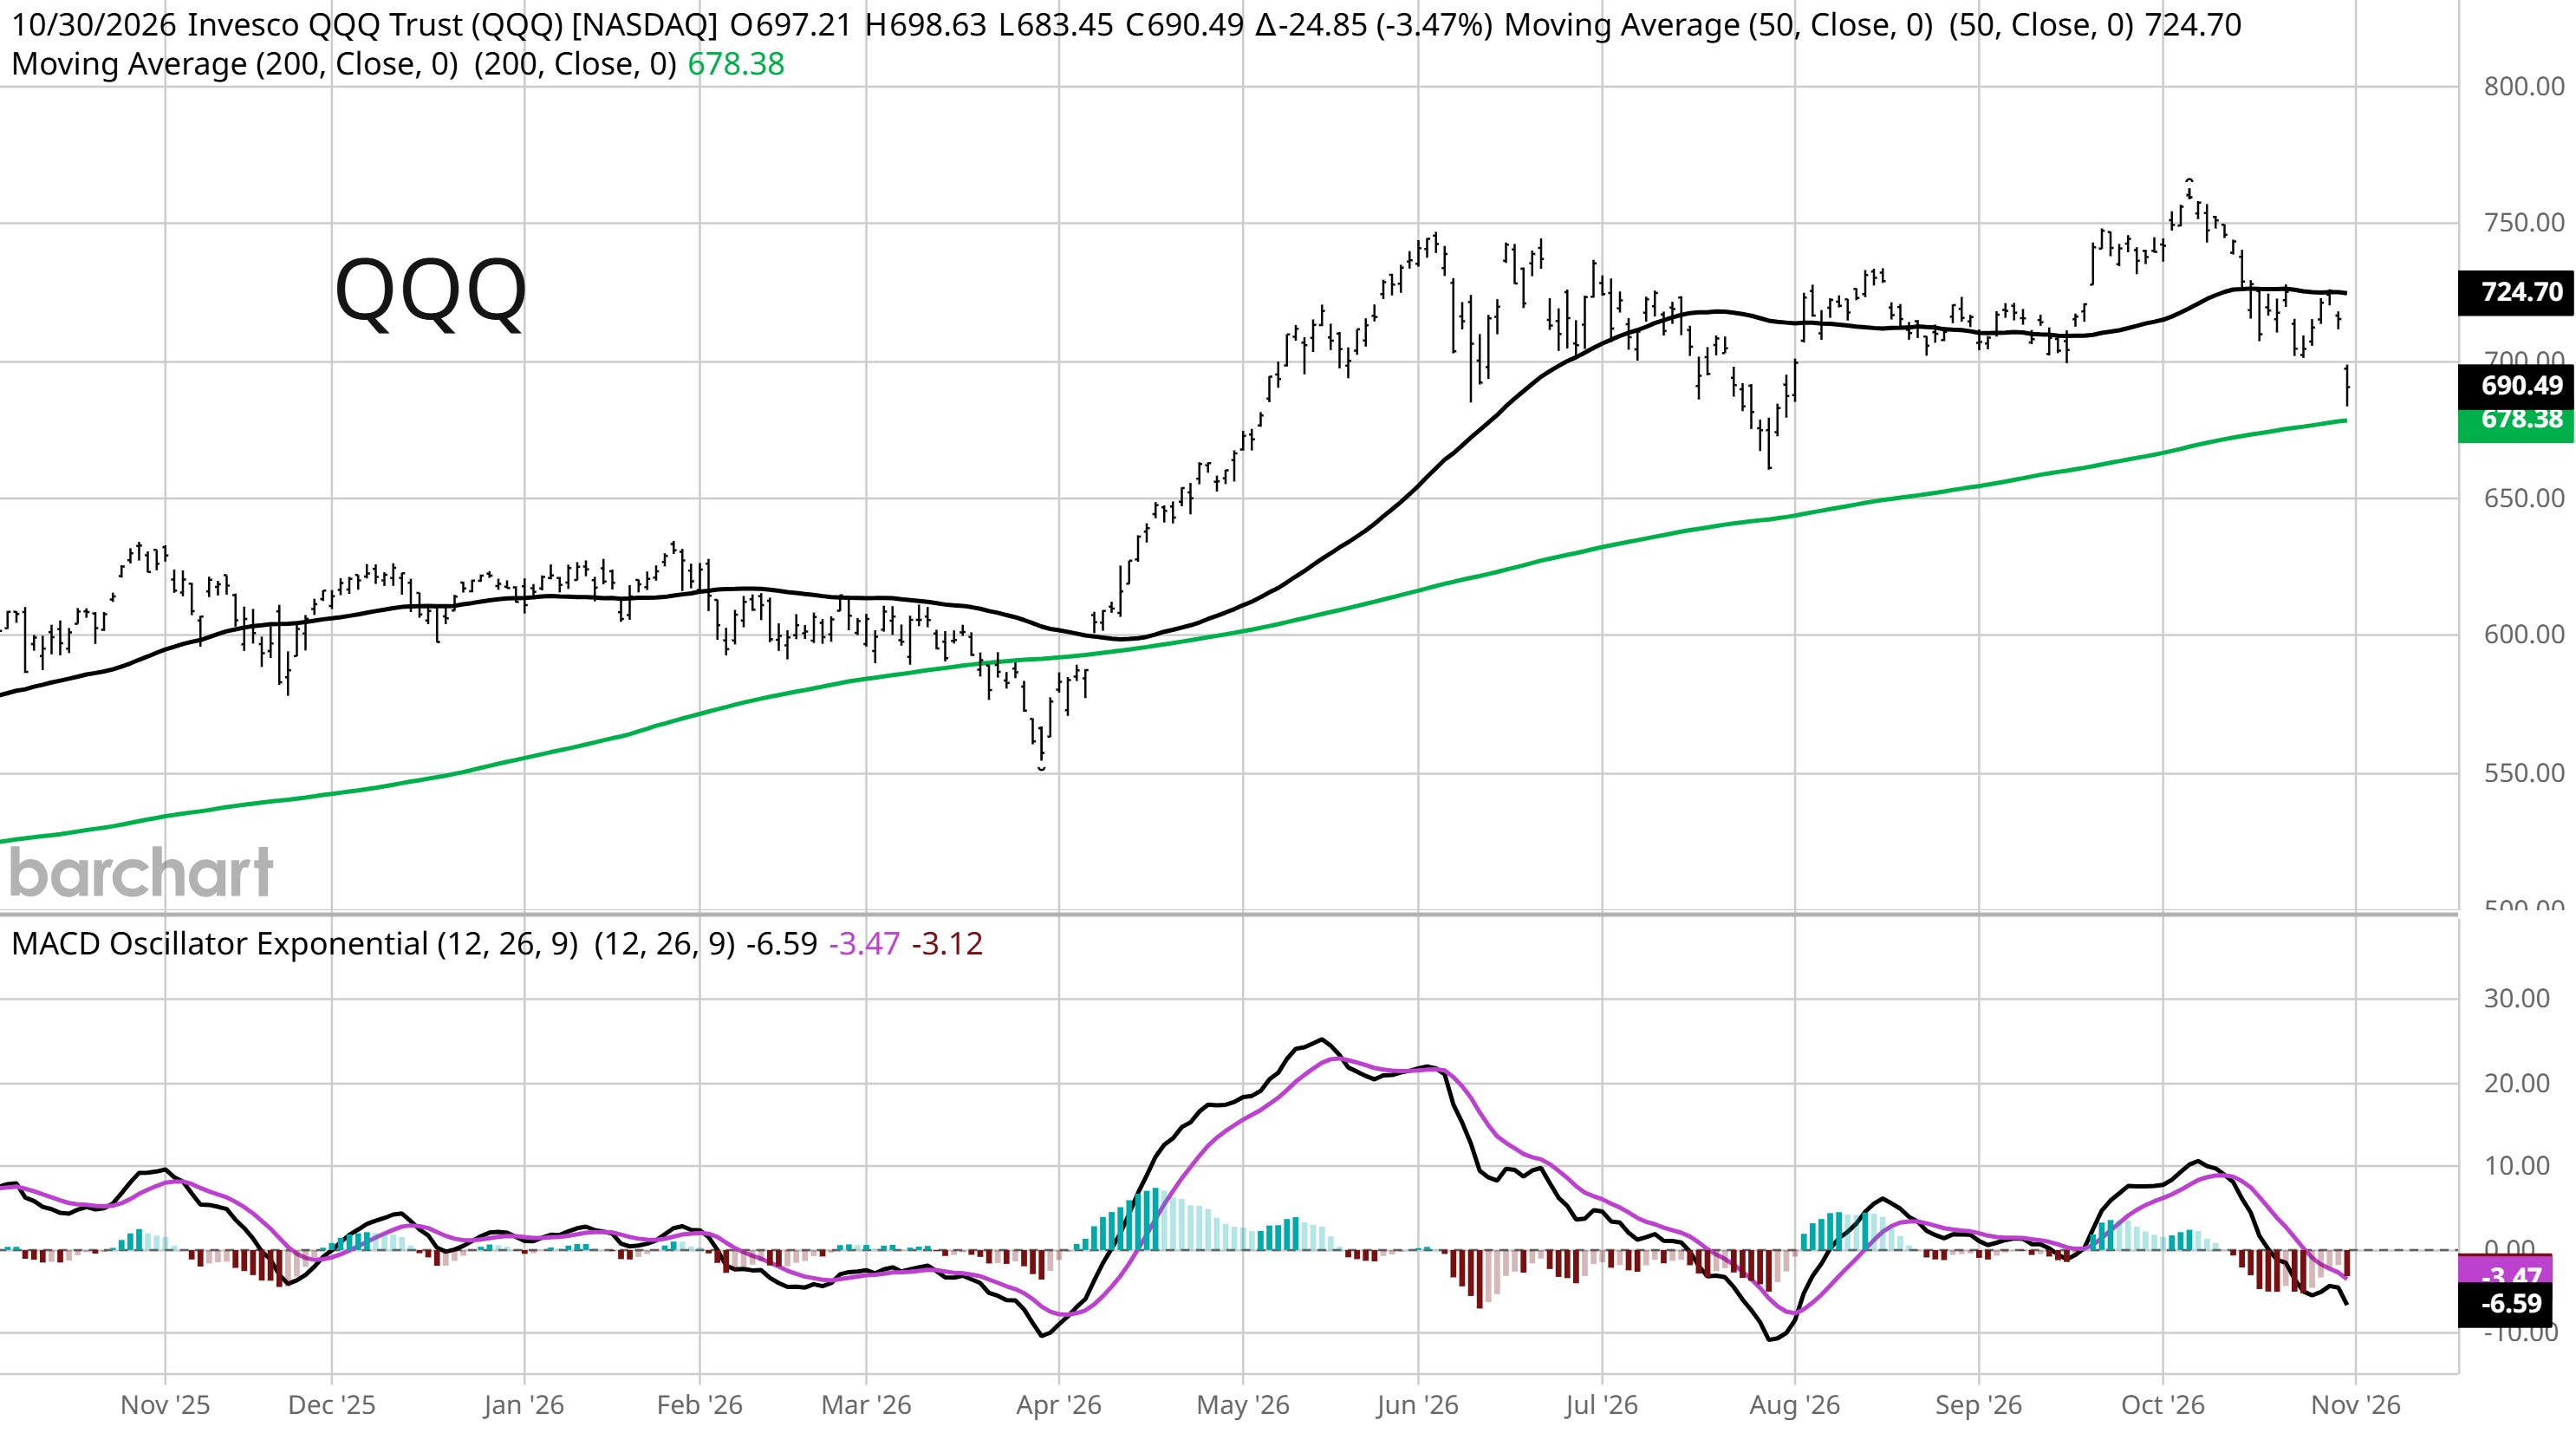
While the outlook for monetary policy is taking a dovish pivot, that hasn’t stopped a sharp selloff across AI-linked stocks. AI hyperscalers including Google-parent Alphabet and Amazon both tumbled following earnings. Intel suffered a one-day drop of nearly 30% in the aftermath of its third quarter earnings release and was the stock’s worst decline since 1974. Investor concerns span everything from excessive capex eating into cash flow, rising costs of raising funds through debt issuance, and if AI infrastructure spending can keep propping up forward earnings estimates. The tech- and AI-heavy Nasdaq has its worst day since June and worst month since March 2025, with the index dropping into correction territory with a 10% decline from the peak in early October. That has QQQ in the chart below close to testing the 200-day moving average (green line).
The selling pressure has been concentrated in AI and growth stocks, which is weighing on capitalization-weighted indexes with heavy exposure. Stock market breadth has been improving over the past several weeks, while the Dow Jones Industrial Average finished October with a 1.7% gain against the Nasdaq’s 5% loss. That means relative strength is emerging elsewhere for targeting trading opportunities.
Keep reading to see:
Open ETF positions.
Open stock positions.
Chart analysis for new trade ideas.
