Mosaic Chart Alerts
3 new stocks for your watchlist as market breadth is washed out.
Welcome back to Mosaic Chart Alerts!
In this newsletter, I’ll focus on the best setups that I’m monitoring for both long and short positions. With a chart and short write-up, this is a quick way to scan and plan potential trade ideas.
And to select these ideas, a lot of work goes on behind the scenes to find stocks offering the right combination of fundamental attributes along with a proper chart setup.
These are my notes from a shortlist of setups I’m monitoring.
Weekly Recap
Its been a wild week for capital markets! The S&P 500, the Nasdaq, and the Russell 2000 Index of small-caps are all testing their mid-June lows. At the same time, currency markets seem to have gone haywire while government bond yields surge. In fact, the 10-year U.S. Treasury yield touched 4.0% today, which is the highest level in more than a decade. As central banks around the world keep unwinding unprecedented levels of stimulus, it sure does feel like something is broken in the financial markets and the domino effect is only beginning to emerge. That’s a reason why I continue to trade with caution and much smaller position sizes.
With the S&P 500 down 14% in just the last six weeks, perhaps it’s no surprise that our watchlist of long setups have not triggered but plenty of short opportunities have been. But the stock market is now at a point where breadth is not just oversold, but completely washed out. The percent of stocks trading above their 20- and 50-day moving averages touched levels last seen during 2020’s epic bear market plunge.
So I would expect some kind of bounce at a minimum, and is part of the reason why I’ve covered all my short positions at this point. It’s also a great time to update our watchlist of long setups, and discover which names have demonstrated true relative strength against this most recent decline. I’m also removing several stocks that have not completed their pattern and are showing relative price weakness, including ORA, ENVX, and NRP. Those names could come back on watch, but right now there are better opportunities.
Long Trade Setups
IRDM
Trading in a consolidation pattern since start of 2021. Recent price action has occurred in a tight range while respecting the 50-day moving average. The $47 level is initial resistance, followed by the prior high near $55.
BOWL
Recent IPO that saw an initial breakout over the $13 level, and has held up well during the recent broader market pullback while the MACD has also reset. Using a move over $14 as a trigger.
NC
Volatile coal stock that could be setting up another breakout. The $55 level is initial resistance in this triangle pattern followed by the 52-week highs at $60. Position size accordingly with this name.
CCRN
Tested the $30 level numerous times since the start of the year. Trading just below that breakout level as the MACD resets on this consolidation, which held above key moving averages despite the broader market pullback.
ERII
I took a long position in this one on the initial breakout over $25 but was stopped out. The pullback has held above the 50-day moving average, so relative strength is still there. Keeping this one on watch for another run at the $25 level.
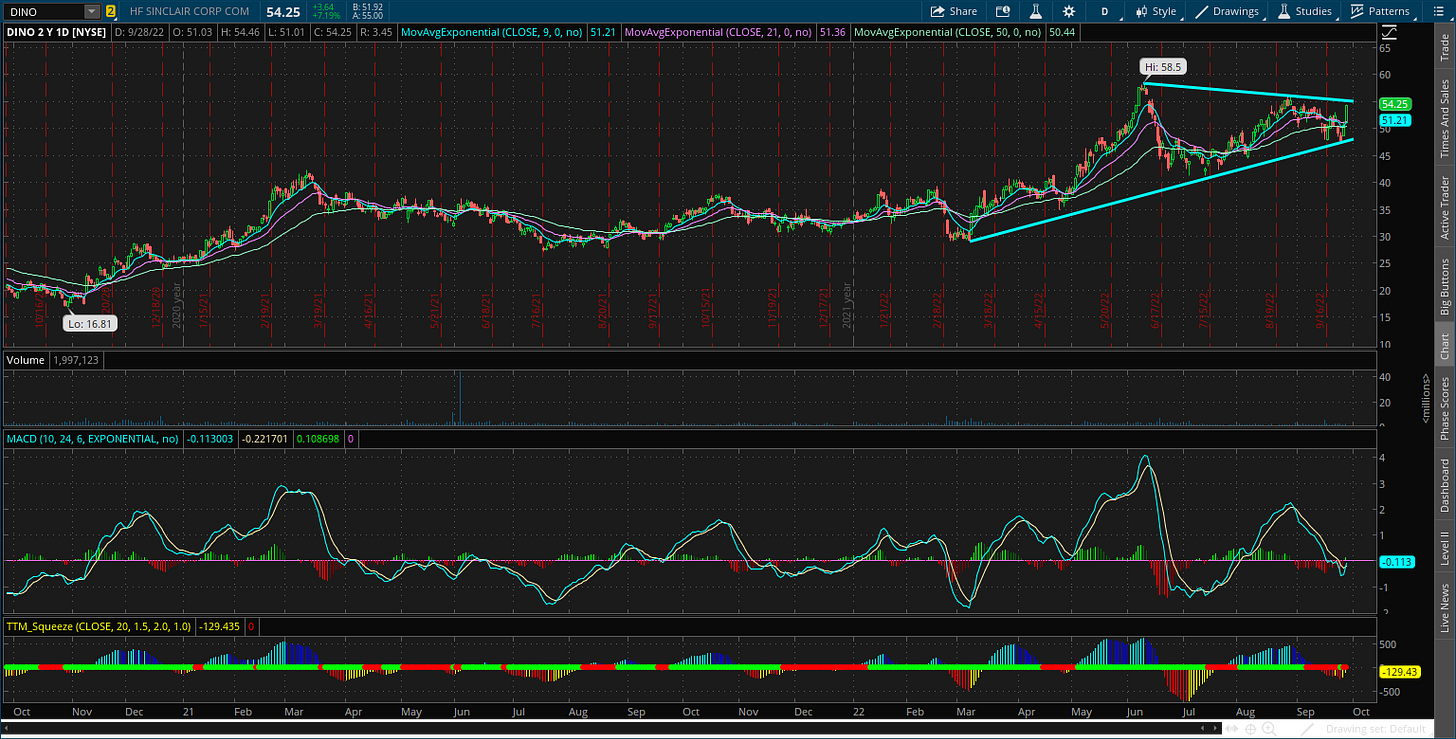
DINO
Keeping this one on watch. Impressive gains last couple days, which is setting up another run at the $57 breakout level. Switched over to the daily chart to show this triangle pattern setting up now.
Short Trade Setups
FVRR
Found support around the $29 level in May and has tested that level several times since, which has allowed the weekly MACD to recharge for another move lower.
CCL
The four-hour MACD was extended to the downside when price broke support, and now trading back inside bear flag pattern. Keeping this one on watch for another breakdown.
Rules of the Game
If you haven’t noticed yet, I trade breakouts! I trade based on the daily chart for long positions. And for price triggers on long setups, I tend to wait until the last half hour of trading to add a position. I find that emotional money trades the open, and smart money trades the close. If it looks like a stock is breaking out, I don’t want a “head fake” in the morning followed by a pullback later in the day.
Also for long positions, I use the 21-day exponential moving average (EMA) as a stop. If in the last half hour of trading it looks like a position will close under the 21-day EMA, I’m usually selling whether it’s to take a loss or book a profit.
For short (or put) positions, I trade off a four-hour chart instead of a daily. Why? There’s a saying that stocks go up on an escalator and down on an elevator. Once a profitable trade starts to become oversold on the four-hour MACD, I start to take gains. Nothing like a short-covering rally to see your gains evaporate quickly, so I’m more proactive taking profits on short positions. I also use a 21-period EMA on the four-hour chart as a stop. If there is a close above the 21-period EMA, I will cover my short.
For updated charts, market analysis, and other trade ideas, give me a follow on twitter: @mosaicassetco
Disclaimer: these are not recommendations and just my thoughts and opinions…do your own due diligence! I may hold a position in the securities mentioned in this newsletter.


