Mosaic Chart Alerts
What happened to Santa? More short setups playing out, while the wrong sector is leading.
Welcome back to Mosaic Chart Alerts!
In this newsletter, I’ll focus on the best setups that I’m monitoring for both long and short positions. With a chart and short write-up, this is a quick way to scan and plan potential trades.
These ideas are the end result of my process to identify stocks offering the right combination of fundamentals along with a proper chart setup.
Here are my notes from a shortlist of setups I’m monitoring.
Stock Market Update
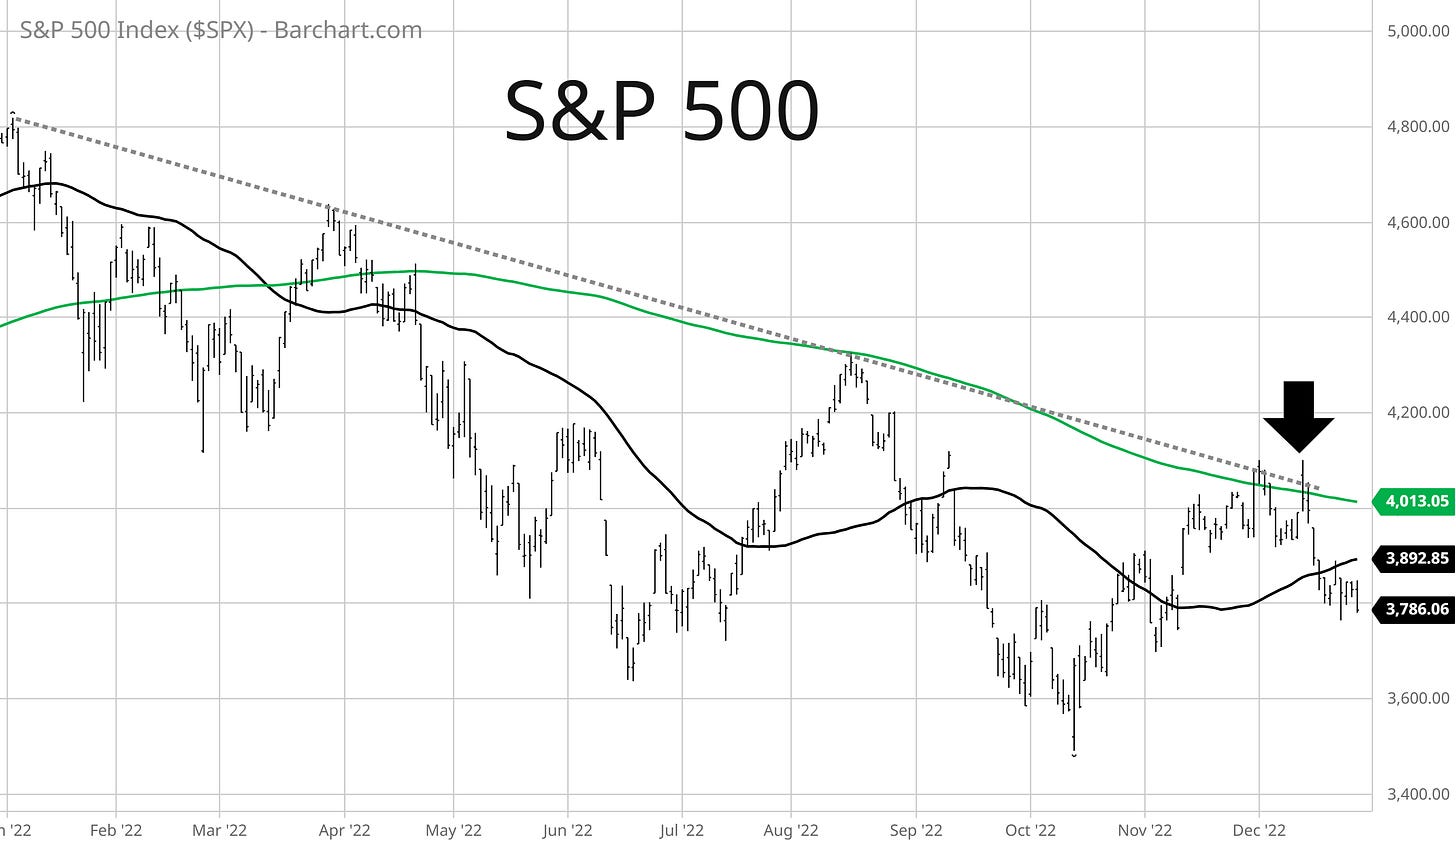
In case there is any doubt that we remain stuck in a bear market, the Nasdaq is sending a stark reminder with an 11% drop so far in December. Depending on what happens over the next two days, that would be the worst December showing since the last tech bubble burst in 2002. And what makes recent price action even more remarkable is that this is supposed to be a strong seasonal week (Santa Claus rally) within a strong seasonal period (November to April). The S&P 500 is pulling back as well, which follows the test of the 200-day moving average and trendline resistance shown with the arrow.
If there’s any good news, it’s that stock market breadth remains near oversold levels (which I covered here) while investor sentiment is quickly becoming more bearish. Those are the right conditions to have in place for a rally to unfold. The bad news is that “risk-on” signals are still rare, meaning I would view any uptrend as just another bear market rally. Just look at the ratio of consumer staples to the S&P 500 below. A rising line means that staples are outperforming the broader market (and vice versa), and is breaking out to new highs. Defensive groups should be lagging if a new bull market was upon us.
Right now cash is king and I’ve recently noted how I’m waiting patiently on the sidelines. That remains the case with a lack of high conviction setups playing out. It’s encouraging to see that recent additions NRP and TS to the list of long setups are attempting to breakout. But this remains a high risk market environment where breakouts are prone to failure. There are a few changes to the list this week. I’m removing KEYS and AEIS as ongoing price weakness invalidates their setups. I’m also removing AMZN from the short monitor as the downside pattern completed. There are also a few new additions to both long and short setups. Keep reading below for more updates.
Long Trade Setups
SCHW
Not a very clean basing structure, but relative strength is holding up quite well in this market. MACD also reset at the zero line and is turning higher. Using the $83-85 resistance level as a possible trigger.
KLXE
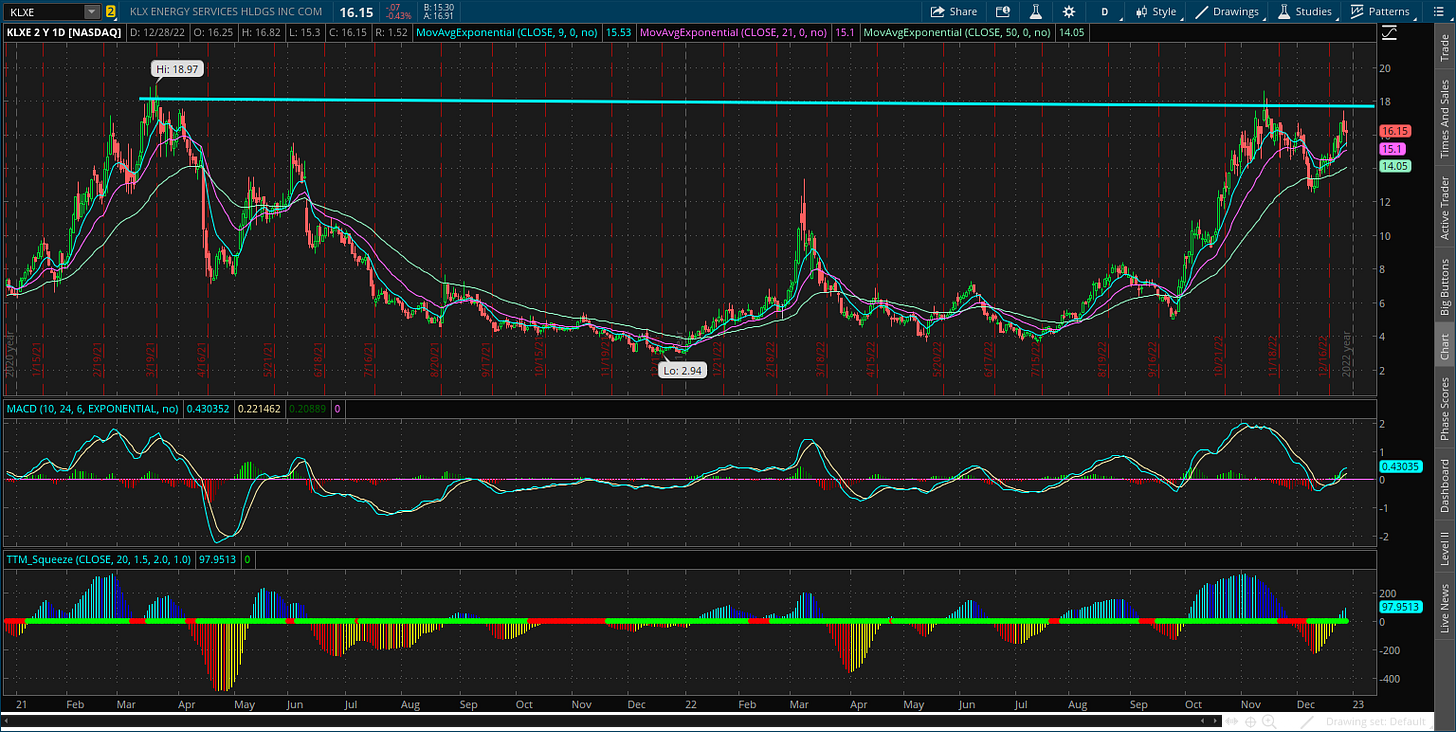
Tested the $19 resistance level from last year then pulled back to the 50-day MA. That pullback has reset the MACD, while momentum is picking up for a potential breakout.
NRP
Mineral rights stock broke out from the triangle consolidation pattern highlighted last week. Don’t want to see price fall back into the pattern, which would point to a failed breakout.
TS
Price broke above the $35 resistance level highlighted last week. That breakout level is now support that is being tested. Similar to NRP, don’t want to see price fall back into the pattern.
RNGR
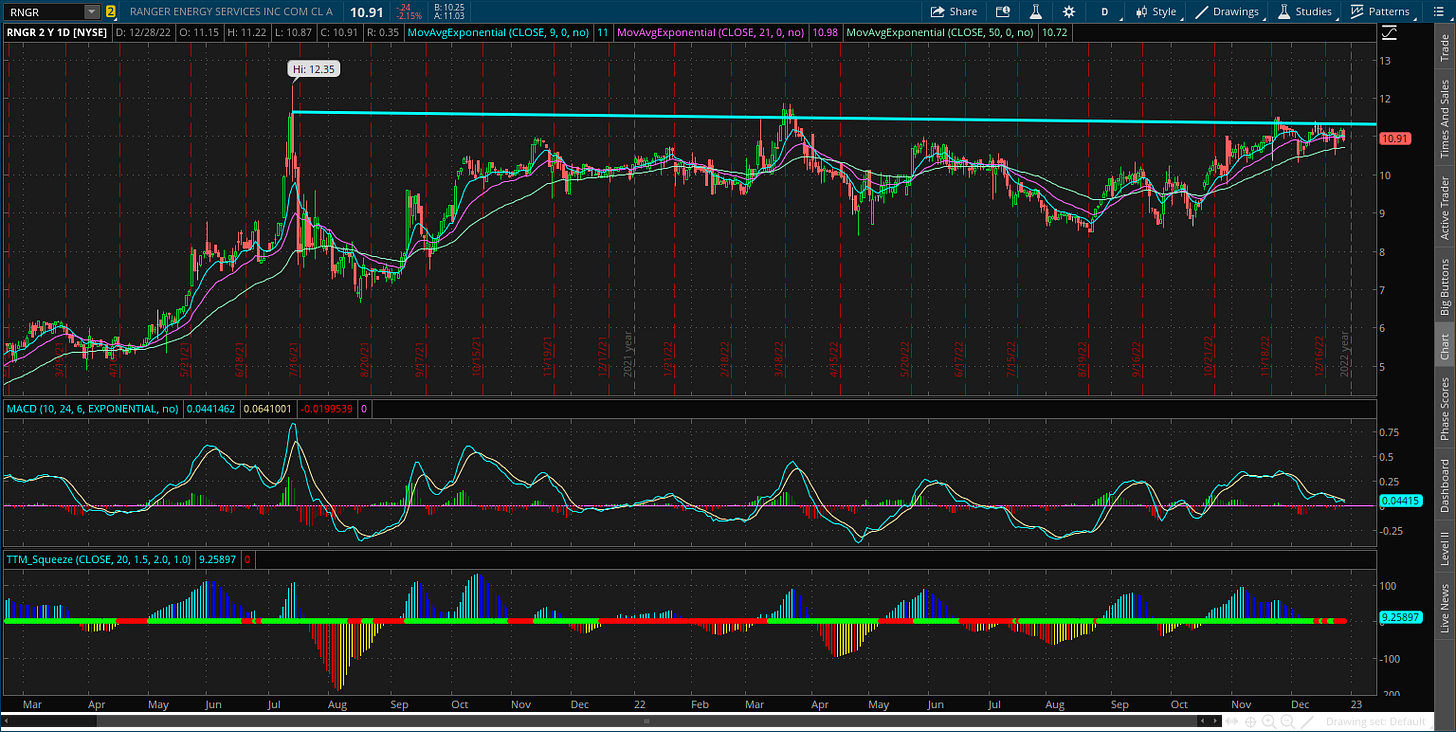
Price resistance around the $11.50 level tested several times over the past 16 months. Still trading in a tight range just below that level. A more speculative smaller-cap name, so position size accordingly.
NSP
Basing pattern going back a year creating a resistance level at $120. Prefer to see the $110 level hold while it trades within the pattern.
Short Trade Setups
DIS
Price is breaking through near-term support at $85. Could be setting up a bigger breakdown under $80, which is support extending back to 2020.
W
Breaking down from the bearish continuation pattern that I’ve been highlighting. The next big support level sits around $29.
DKNG
This descending triangle pattern remains in play. After rejecting off trendline resistance, price is sitting right on $11 support which is also the trigger level.
Rules of the Game
If you haven’t noticed yet, I trade breakouts! I trade based on the daily chart for long positions. And for price triggers on long setups, I tend to wait until the last half hour of trading to add a position. I find that emotional money trades the open, and smart money trades the close. If it looks like a stock is breaking out, I don’t want a “head fake” in the morning followed by a pullback later in the day.
Also for long positions, I use the 21-day exponential moving average (EMA) as a stop. If in the last half hour of trading it looks like a position will close under the 21-day EMA, I’m usually selling whether it’s to take a loss or book a profit.
For short (or put) positions, I trade off a four-hour chart instead of a daily. Why? There’s a saying that stocks go up on an escalator and down on an elevator. Once a profitable trade starts to become oversold on the four-hour MACD, I start to take gains. Nothing like a short-covering rally to see your gains evaporate quickly, so I’m more proactive taking profits on short positions. I also use a 21-period EMA on the four-hour chart as a stop. If there is a close above the 21-period EMA, I tend to cover my short.
For updated charts, market analysis, and other trade ideas, give me a follow on twitter: @mosaicassetco
Disclaimer: these are not recommendations and just my thoughts and opinions…do your own due diligence! I may hold a position in the securities mentioned in this newsletter.


