

Welcome back to Mosaic Chart Alerts!
In this post, I’ll focus on setups that I’m monitoring for both long and short positions. With a chart and short write-up, this is a quick way to scan and plan potential trades.
These ideas are the end result of my process to identify stocks offering the right combination of fundamentals along with a proper chart setup.
Here are my notes from a focus list of setups I’m monitoring.
Stock Market Update
A holiday-shortened week in the U.S. with a lack of important economic releases is putting the focus back on corporate earnings. Nvidia’s (NVDA) fourth quarter earnings report is capturing the spotlight, while Goldman Sachs has dubbed the company’s stock the most important on earth. And Nvidia’s financial results didn’t disappoint. The company’s processors are the workhorse for artificial intelligence (AI) applications, and demand continues booming. Nvidia stated that total revenue soared 265% to over $22 billion in the quarter. But while investors are focusing on one stock market bellwether, don’t forget that it’s a market of stocks.
The intersection of the stock market’s trend, participation in that trend (breadth), and the sentiment of investors can help determine the near- and intermediate-term prospects and risks to the outlook. Looking first at breadth, participation has become somewhat mixed following several breadth thrusts late last year indicating strong involvement by institutional investors. Net new 52-week highs are recently struggling to remain in positive territory (chart below), while the percent of stocks trading above their 20-day moving average is hovering around 50% as the S&P 500 is near the highs.

Meanwhile, sentiment among investors is near bullish extremes. CNN’s Fear & Greed Index is just outside of “extreme greed” territory while the NAAIM survey of active investment managers shows tactical equity exposure moderating slightly from the third highest level of the past two years. At the same time, the S&P 500 is entering a weak seasonal stretch for returns based on 20-year historic trends. You can see in the chart below that the S&P 500 tends to see one of the worst pullbacks of the calendar year from mid-February through mid-March.

The combination of weak seasonals, bullish sentiment, and worsening breadth is something to be monitored. But it’s not a signal that a pullback is imminent. Rather, it shows that conditions under the hood are deteriorating which means a couple things for my approach. First, I will continue to take new positions that are breaking out but am very quick to take stop losses. Next, I become more proactive in taking partial gains if they present themselves rather than waiting for a close below key moving averages. Big picture, I believe this bull market remains intact but it will not be reflected by a straight move higher stock prices. At some point, the S&P will need to mean-revert and consolidate to set the stage for more gains. For this week, I am removing APP as the stock breaks out and am updating watchlist charts and levels of interest.
Keep reading below for all the updates…
Long Trade Setups
CELH
Stock consolidating since early September following a run to new highs. Initial resistance at the $63 level, but would like to see the MACD reset at zero before attempting a breakout over $70.

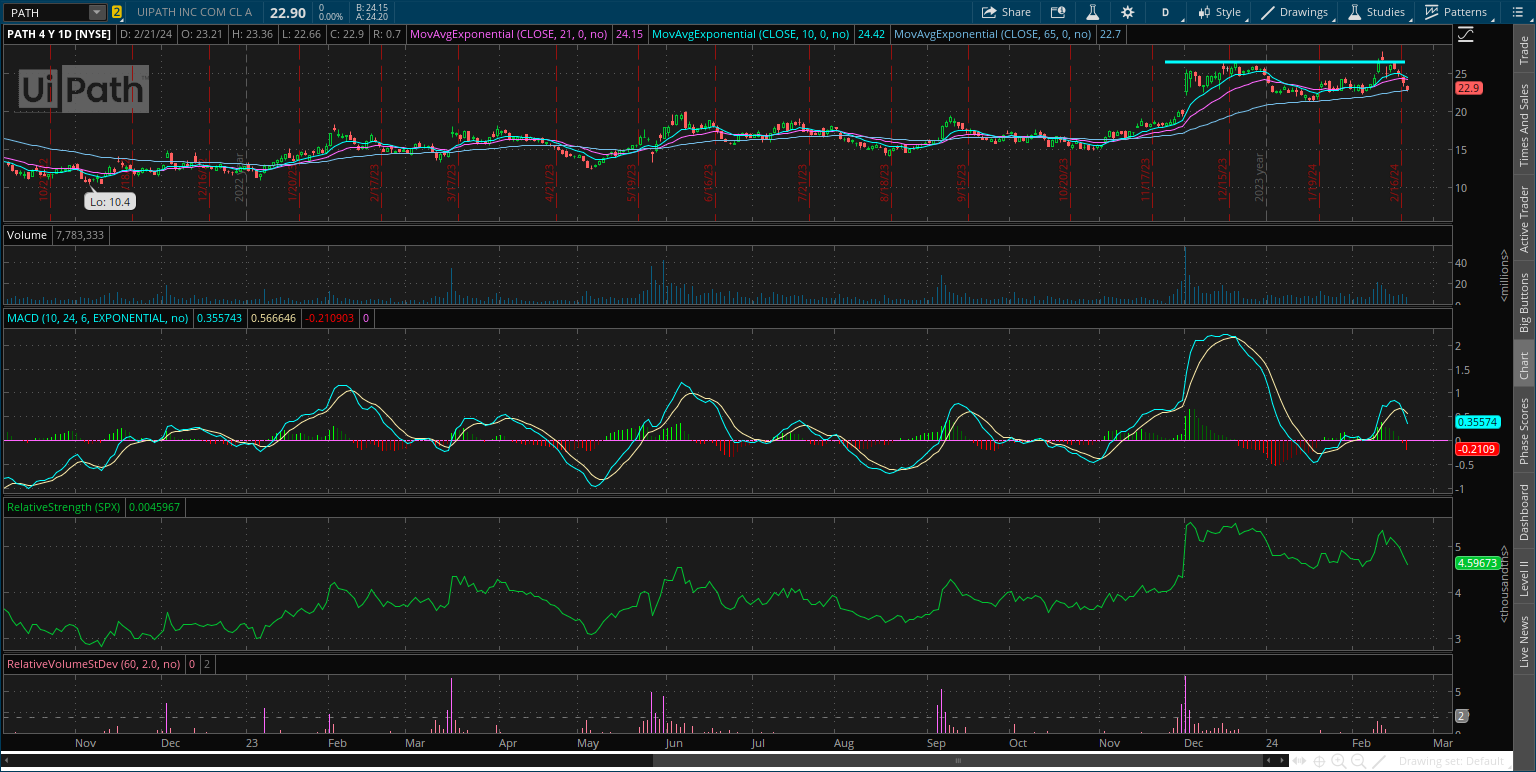
PATH
Attempting to emerge from a bottoming base going back nearly two years. Stock basing since December after breaking out over the $20 level. Now watching for a move over $27.
AXON
Created a saucer-like basing pattern from March to December last year. Broke out over resistance at $230 and went back to test that level. Attempting to make another breakout but not being confirmed by the relative strength (RS) line so far.

STNE
Starting to emerge from a bottoming base going back two years. Took out resistance at $15 and now consolidating the gains. Trading sideways since late December, with a new resistance level near the $19 level.

ERJ
Recently testing the $20 level, which is resistance from 2021. Pulling back from that level while also finding support near the $16.50 area along with a MACD reset. Watching for a move over $20 with confirmation from the RS line.

IOT
Consolidating gains since the start of December after the breakout to new highs over the $30 level. The RS line has weakened more than ideal, but support at the $30 level is being respected. Looking a move to new highs over $35.

BX
Since peaking back in 2021, the chart has the appearance of a large saucer-type pattern. Price recently nearing the prior high at $140 and now pulling back. That’s resetting the MACD while price holds support at $115. Watching for a move to new highs over $140.

GES
Keeping on the watchlist for now as long as support at $20 holds. Still watching resistance at $24, which is a level tested several times going back to 2021. Series of higher lows since last October’s bottom. A breakout could target the prior high near $29.

Short Trade Setups
None this week!
Rules of the Game
I trade chart breakouts based on the daily chart for long positions. And for price triggers on long setups, I tend to wait until the last half hour of trading to add a position. I find that emotional money trades the open, and smart money trades the close. If it looks like a stock is breaking out, I don’t want a “head fake” in the morning followed by a pullback later in the day.
I also use the RS line as a breakout filter. I find this improves the quality of the price signal and helps prevent false breakouts. So if price is moving out of a chart pattern, I want to see the RS line (the green line in the bottom panel of my charts) at new 52-week highs. Conversely, I prefer an RS line making new 52-week lows for short setups.
Also for long positions, I use the 21-day exponential moving average (EMA) as a stop. If in the last half hour of trading it looks like a position will close under the 21-day EMA, I’m usually selling whether it’s to take a loss or book a profit.
For short (or put) positions, I trade off a four-hour chart instead of a daily. Why? There’s a saying that stocks go up on an escalator and down on an elevator. Once a profitable trade starts to become oversold on the four-hour MACD, I start to take gains. Nothing like a short-covering rally to see your gains evaporate quickly, so I’m more proactive taking profits on short positions. I also use a 21-period EMA on the four-hour chart as a stop. If there is a close above the 21-period EMA, I tend to cover my short.
For updated charts, market analysis, and other trade ideas, give me a follow on X: @mosaicassetco
Disclaimer: these are not recommendations and just my thoughts and opinions…do your own due diligence! I may hold a position in the securities mentioned in this post.