

In this post, I’ll focus on setups that I’m monitoring for both long and short positions. With a chart and short write-up, this is a quick way to scan and plan potential trades.
These ideas are the end result of my process to identify stocks offering the right combination of growth fundamentals along with a proper chart setup.
Stock Market Update
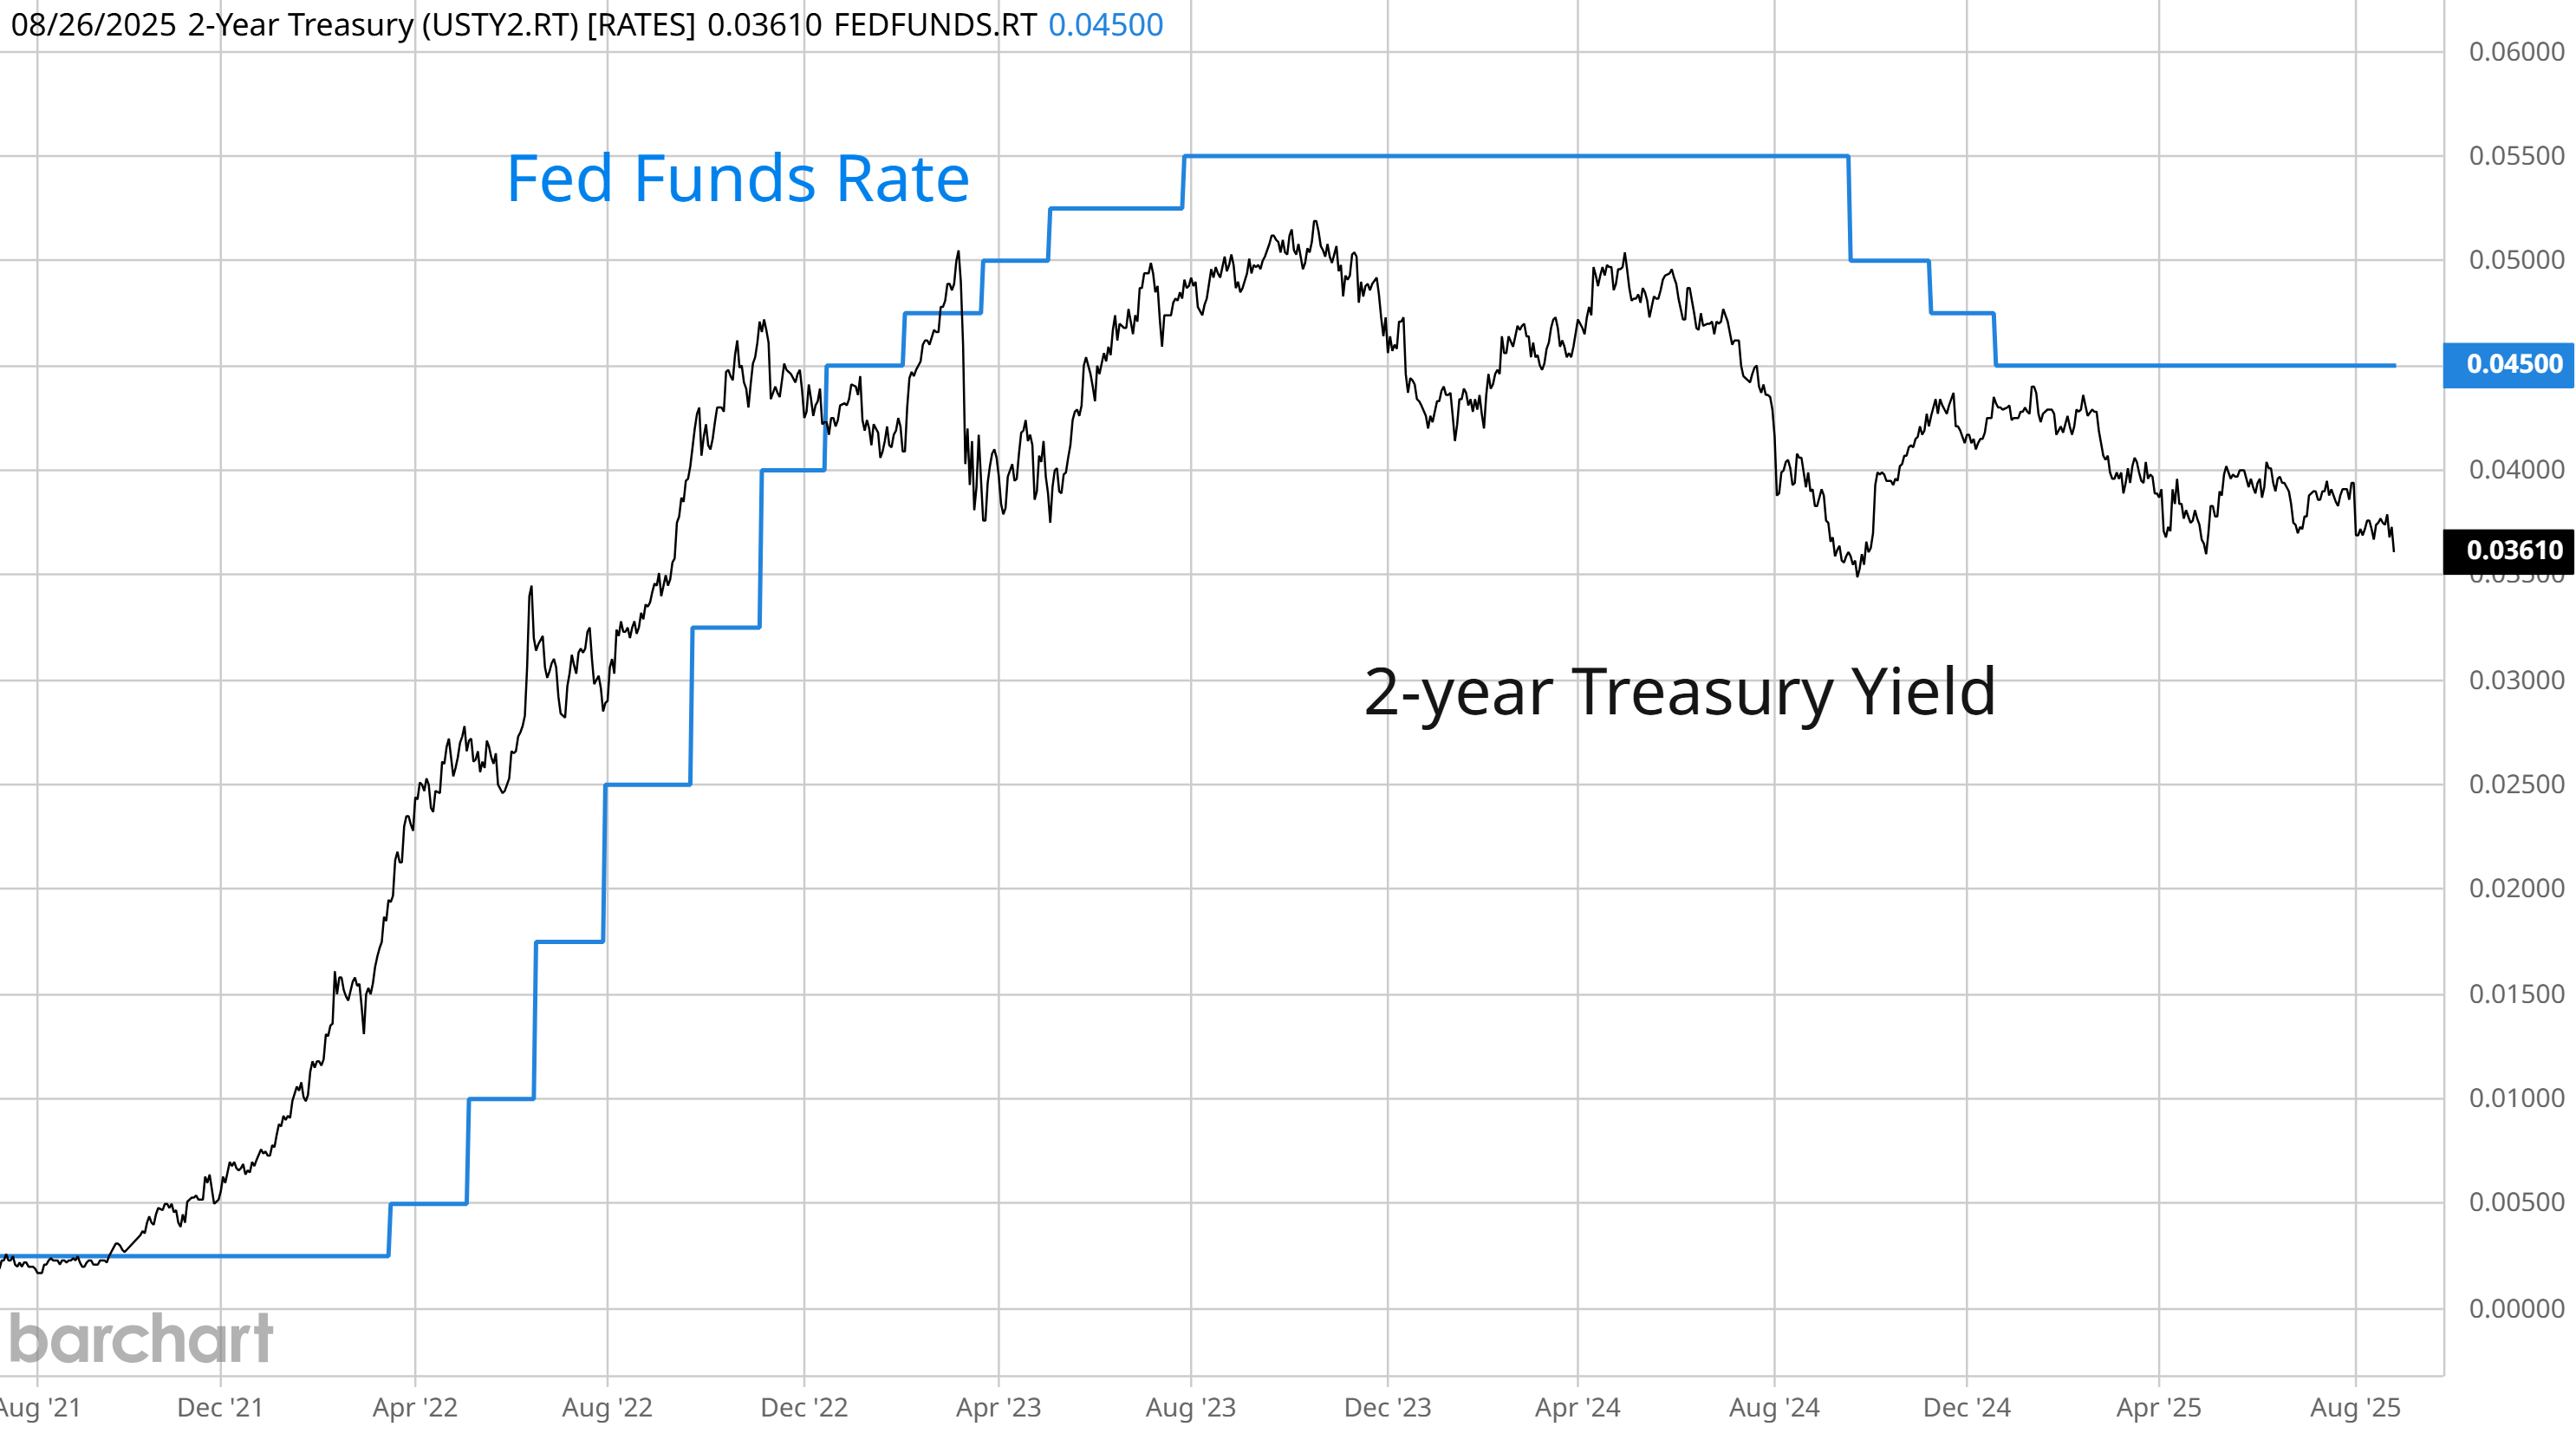
Market-based outlooks for rate cuts from the Federal Reserve are gaining after Chair Jerome Powell’s Jackson Hole speech. Powell’s speech was largely taken as a dovish pivot, which is putting expectations for interest rate cuts back on the table. The 2-year Treasury yield tends to lead changes in the short-term fed funds rate, and is now at a level suggesting three quarter point cuts (chart below). However, the Fed is also abandoning average inflation targeting, which allowed for above target inflation if it meant supporting the the labor market. With core CPI inflation most recently reported at 3.1%, that’s well above the Fed’s 2% inflation target and is at odds with easing policy.
While market-based indicators like the 2-year Treasury view more rate cuts ahead, the performance in the average stock seems to agree. Breadth had already started improving ahead of Powell’s speech, and has surged ever since. That’s triggering breadth thrusts that you tend to see when the stock market is finding a bottom after a selloff, not when it’s near record highs. But that’s exactly what happened on Friday following Powell’s speech, which saw advancing stocks on the NYSE at 90% of the total while up volume was over 90% as well. The table below shows past “90/90” days on the NYSE along with forward returns for the S&P 500, where the average gain six months from the event is 16% with 83% of periods positive.

While much has been made about impact of the “Mag 7” and their large weight in the major cap-weighted indexes, breadth metrics show the average stock is participating in the rally which is a positive sign looking ahead. Key cyclical sectors are picking up as well, which is a positive sign on the economic outlook. Keep reading to see:
Open ETF positions.
Open stock positions.
Chart analysis for new trade ideas.
