

Welcome back to Mosaic Chart Alerts!
In this newsletter, I’ll focus on the best setups that I’m monitoring for both long and short positions. With a chart and short write-up, this is a quick way to scan and plan potential trades.
These ideas are the end result of my process to identify stocks offering the right combination of fundamentals along with a proper chart setup.
Here are my notes from a focus list of setups I’m monitoring.
Stock Market Update
Following a strong finish in the markets last week, Federal Reserve Chair Jerome Powell took a wrecking ball to stocks with his comments on interest rates and the economy. In testimony to Congress, Powell made sure to convey that the central bank is committed to ramping up rate hikes and keeping them higher for longer. That led to a massive shift in expectations around the size of the next interest rate increase due in two weeks. Market implied odds a week ago showed a 70% chance that the Fed would raise rates by just 0.25%. Now it’s nearly 80% odds that it will be 0.50% instead as you can see in the chart below from CME Group.

The S&P 500 has pulled back 1.3% so far this week in response, which has brought the Index back to a confluence of key levels including trendline support off the October lows plus the the 50- and 200-day moving average (chart below). And the roller coaster ride could just be getting started. That’s because Powell made clear that the size and pace of further hikes would depend on incoming economic data. Since the Fed is mandated with keeping people employed and prices stable, this Friday’s jobs report and next week’s inflation reading with the Consumer Price Index (CPI) will become a flashpoint for traders.

But instead of being consumed by every economic report and agonizing over the stock market’s whipsaws, its pays to stay objective and disciplined. I’ve discussed how I’m watching the action in cyclical sectors to confirm if the next broader market move will be bullish or bearish, and that remains the case. I’m also monitoring my watchlist charts for trading opportunities.
And this spotlights one benefit of being a breakout trader. Given the lack of quality moves from constructive chart patterns over the past several weeks, I’ve stayed mostly in cash as stocks chop around. I do have a few updates to the watchlist this week, including the removal of GEF and HOG due to weak price action that’s invalidating their setups. On the short watchlist, MKC and TSN are in the early stages of breaking price support to complete their chart pattern. I will keep those stocks on watch for another week to monitor the setups.
Keep reading below for all the updates…
Long Trade Setups
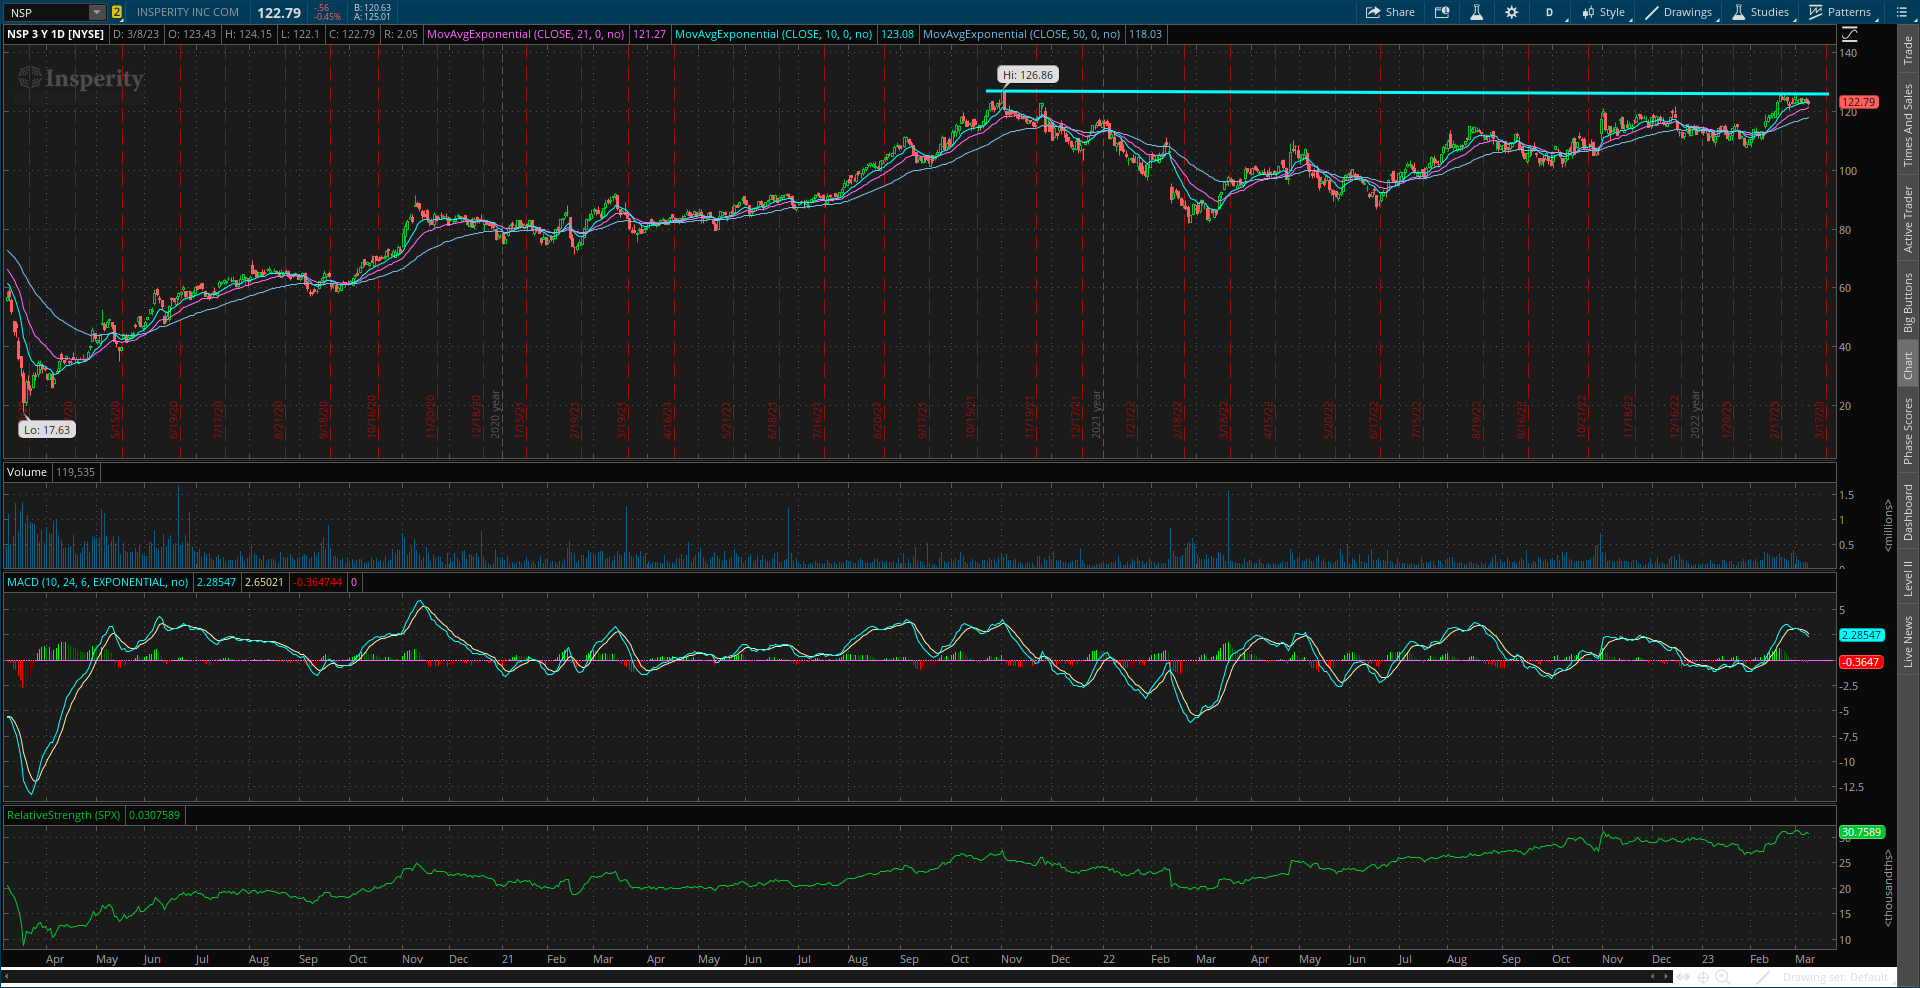
NSP
Ran up to test the $127 resistance level. Momentum became extended on that gain with the MACD now resetting, which helps the breakout setup. Relative strength (RS) line hovering near the highs.
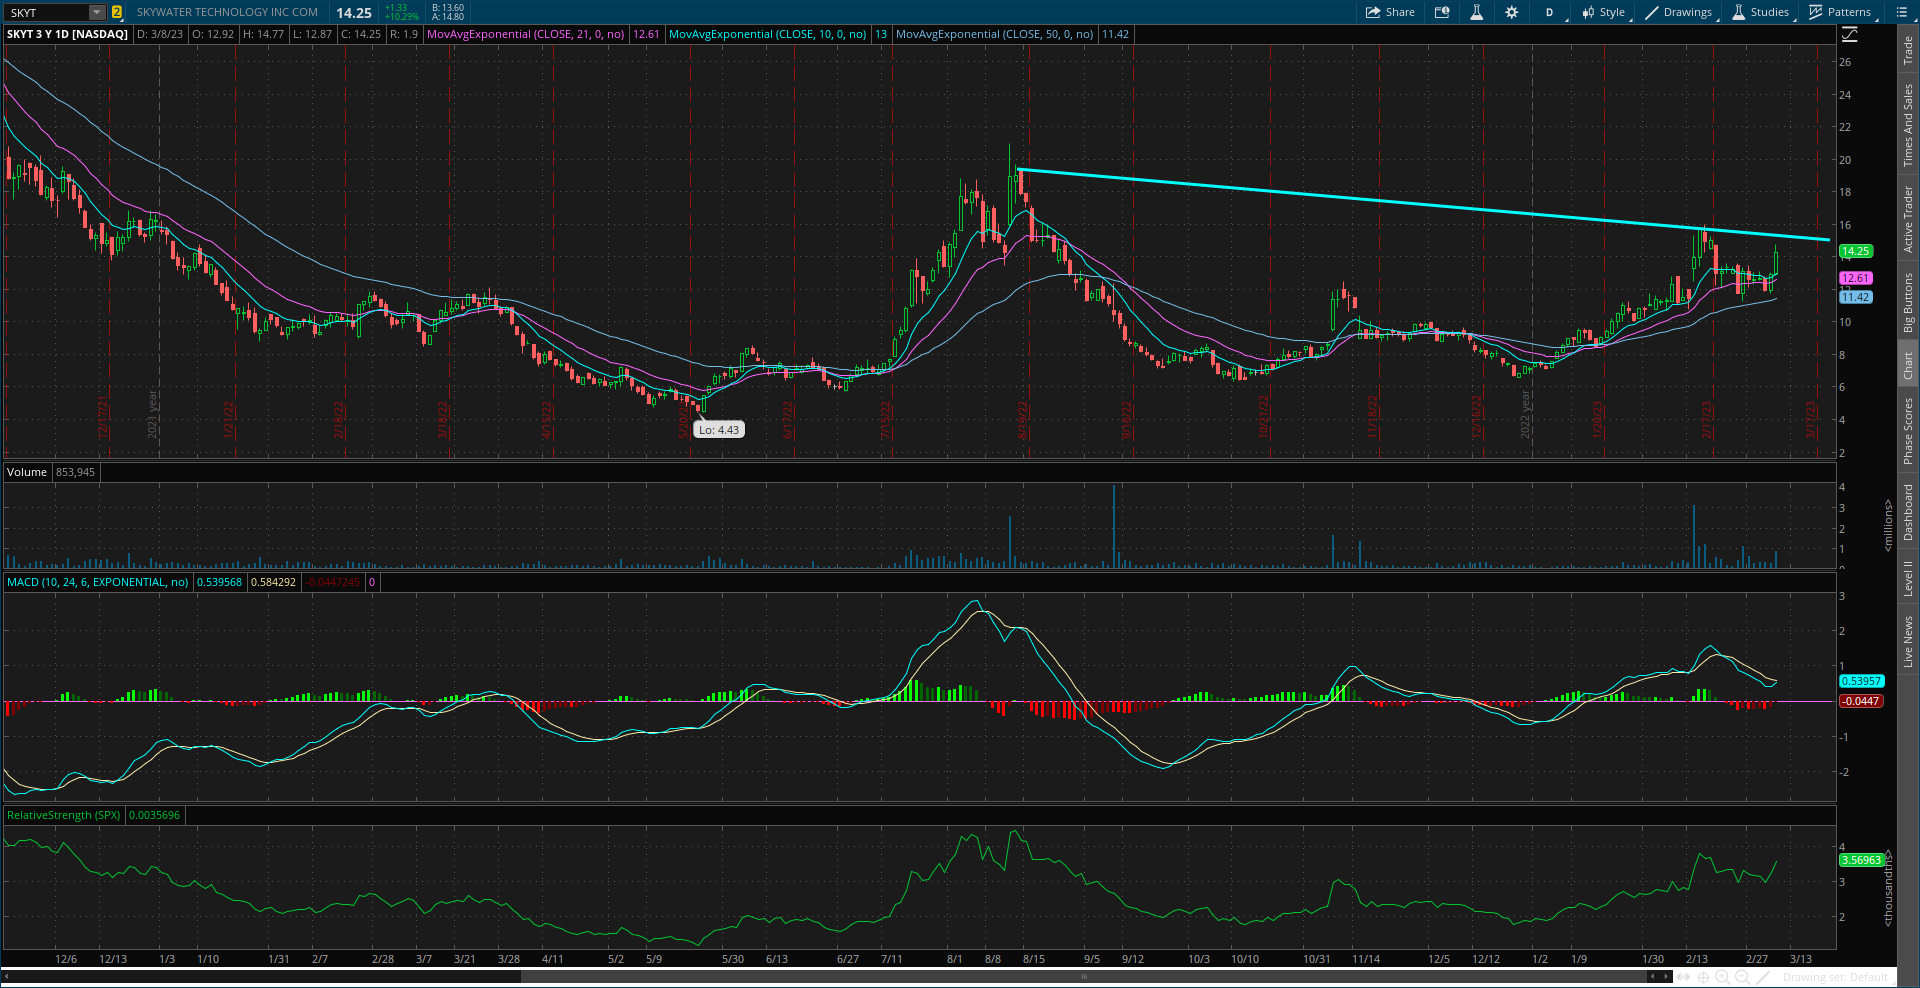
SKYT
Small-cap semiconductor stock holding key moving averages on the recent pullback, and now turning back higher to test trendline resistance. Looking for a move over $15. A more volatile stock so position size accordingly on a breakout.
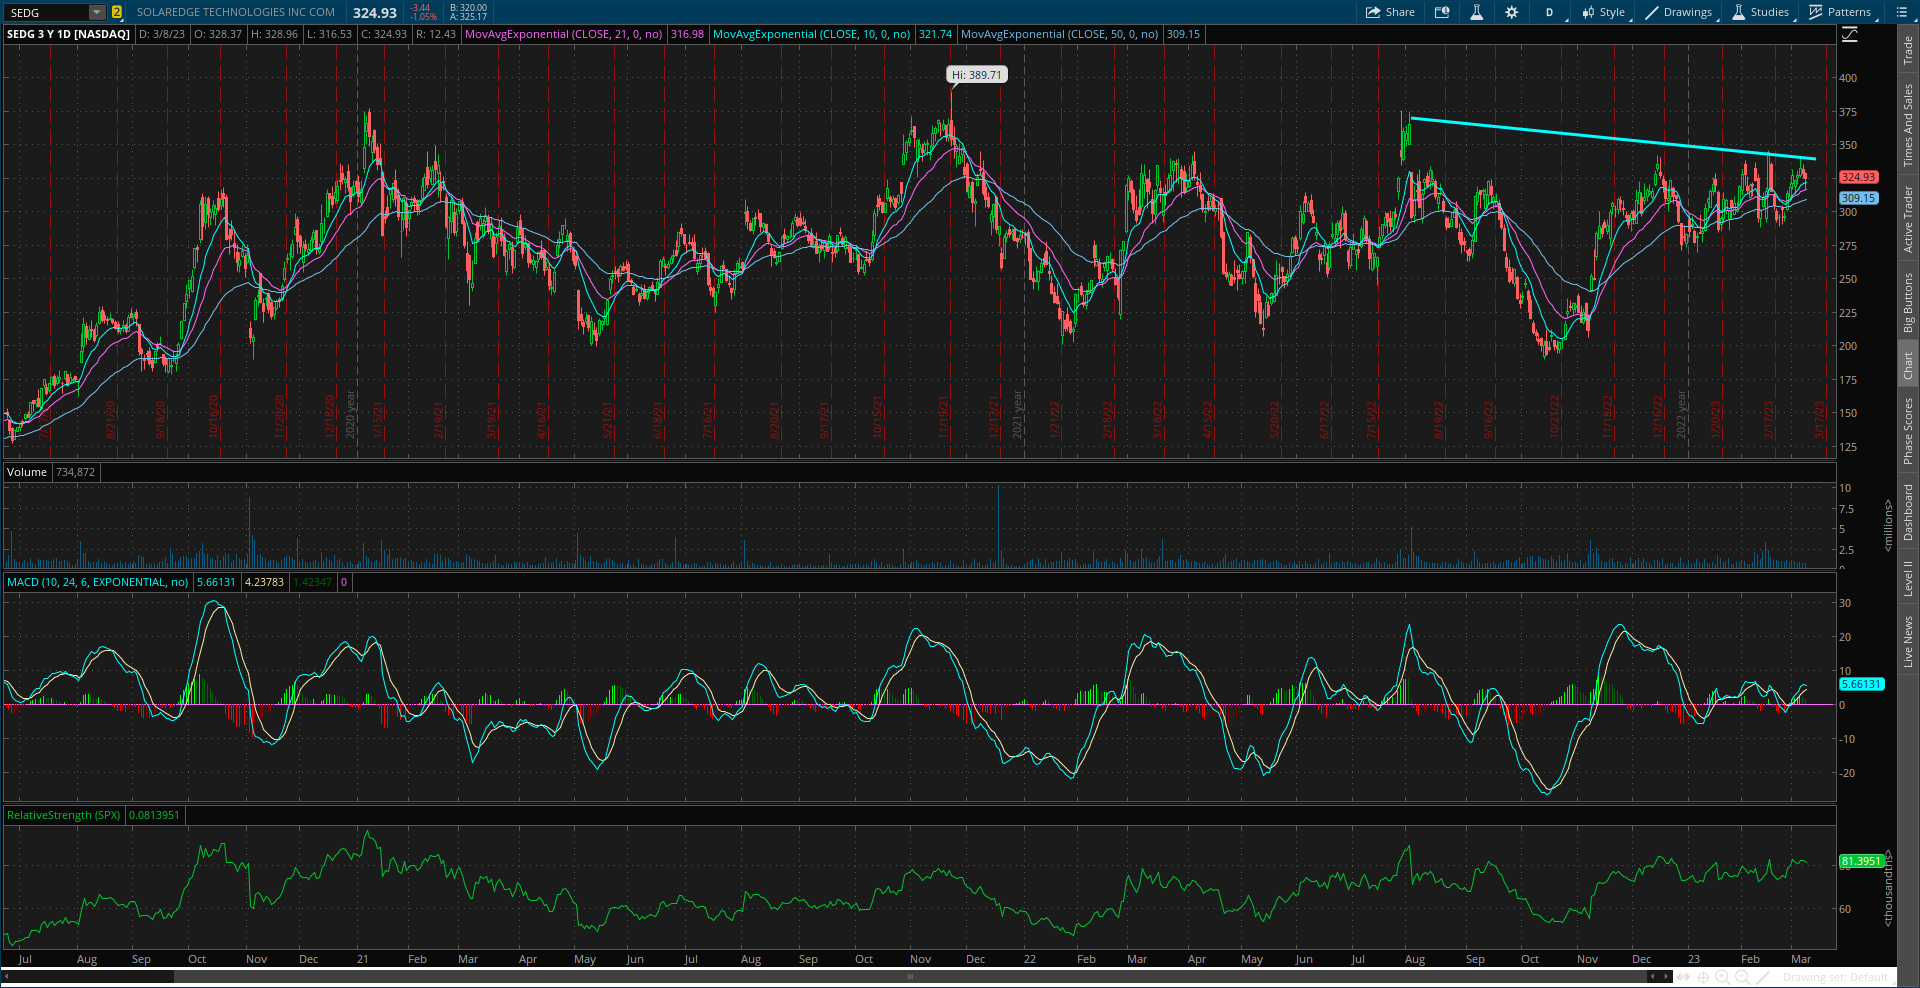
SEDG
Watching trendline resistance now around the $340 area. Looking for additional confirmation with a move above the prior highs around $370 and the RS line moving to new highs.
GFS
Recent IPO that tried to break above $70 resistance and failed. The pullback is resetting the MACD at the zero line while the RS line is hovering near the highs. Looking for another attempt at $70 that can test the prior high at $80.

OC
Building products stock that ran up to prior resistance highs around $105. Expect the recent pullback to set up another breakout attempt. Also notable that the RS line is staying close to new highs.

AVNW
Massive consolidation pattern in the works for nearly two years. Rallying off support at the $35 level which is also the gap higher. Seeing the MACD reset closer to zero before trying to breakout over the $40 level.

Short Trade Setups
MKC
Testing trendline support at the $73 level, which also follows a MACD reset under the zero line. Expect a breakdown to first target $70, with not much support below that level.

TSN
Testing support at the $59 area, which is an important level going back to 2021. Both the MACD and RS line in a position to support a breakdown.

SPWR
Targeting a move below the $14 support level, which is being tested frequently. MACD and RS line still in position to support a move lower.

RUN
Creating a bearish triangle continuation pattern. Tested trendline support again recently around the $23 level, where I’m watching for a close below.

Rules of the Game
If you haven’t noticed yet, I trade breakouts! I trade based on the daily chart for long positions. And for price triggers on long setups, I tend to wait until the last half hour of trading to add a position. I find that emotional money trades the open, and smart money trades the close. If it looks like a stock is breaking out, I don’t want a “head fake” in the morning followed by a pullback later in the day.
New Filter: After extensive back testing and live implementation, I am adding new highs on the RS line as a breakout filter. I find this improves the quality of the price signal and helps prevent false breakouts. So if price is moving out of a chart pattern, I want to see the RS line (the green line in the bottom panel of my charts) at new 52-week highs. Conversely, I prefer an RS line making new 52-week lows for short setups.
Also for long positions, I use the 21-day exponential moving average (EMA) as a stop. If in the last half hour of trading it looks like a position will close under the 21-day EMA, I’m usually selling whether it’s to take a loss or book a profit.
For short (or put) positions, I trade off a four-hour chart instead of a daily. Why? There’s a saying that stocks go up on an escalator and down on an elevator. Once a profitable trade starts to become oversold on the four-hour MACD, I start to take gains. Nothing like a short-covering rally to see your gains evaporate quickly, so I’m more proactive taking profits on short positions. I also use a 21-period EMA on the four-hour chart as a stop. If there is a close above the 21-period EMA, I tend to cover my short.
For updated charts, market analysis, and other trade ideas, give me a follow on Twitter: @mosaicassetco
Disclaimer: these are not recommendations and just my thoughts and opinions…do your own due diligence! I may hold a position in the securities mentioned in this newsletter.