In this post, I’ll focus on setups that I’m monitoring for both long and short positions. With a chart and short write-up, this is a quick way to scan and plan potential trades.
These ideas are the end result of my process to identify stocks offering the right combination of growth fundamentals along with a proper chart setup.
Stock Market Update
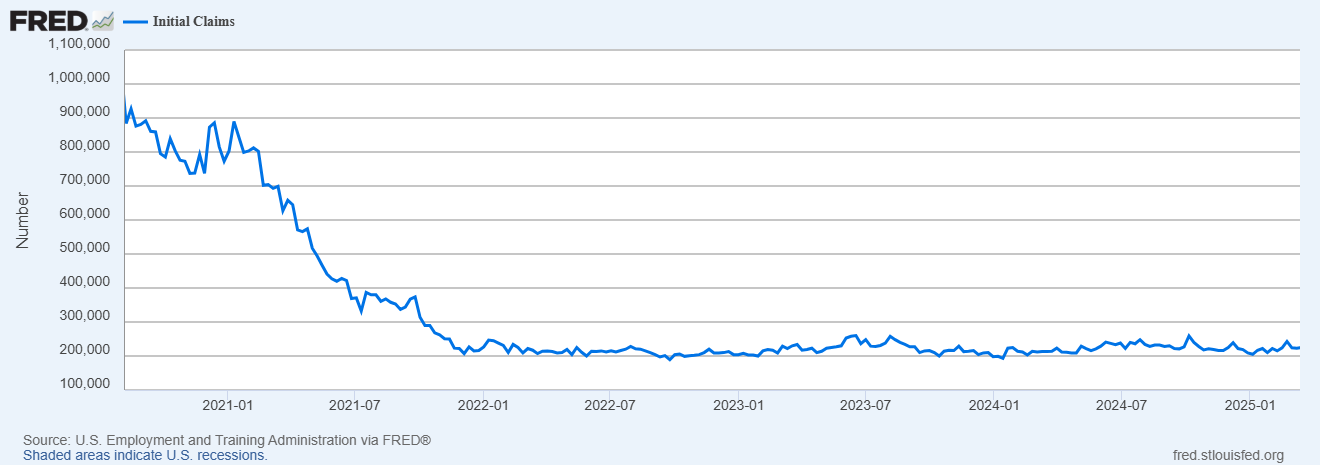
The final report on 4Q GDP growth showed a 2.4% annualized increase in the last quarter of 2024, but uncertainty around tariffs and trade wars is clouding the outlook ahead. The Atlanta Fed’s GDPNow estimate for first quarter GDP growth currently stands at -1.8% annualized. The drop is being driven primarily by a pullback in net exports, while consumer spending is weakening as well. While there’s much anxiety around the impact of tariffs and federal government job cuts, it’s worth noting that initial jobless claims are still running at low levels. Claims are reported weekly, which offers a high frequency and real-time look at the labor market. Coming off the pandemic-era recession spike, claims have stayed in a narrow range at historically low levels.
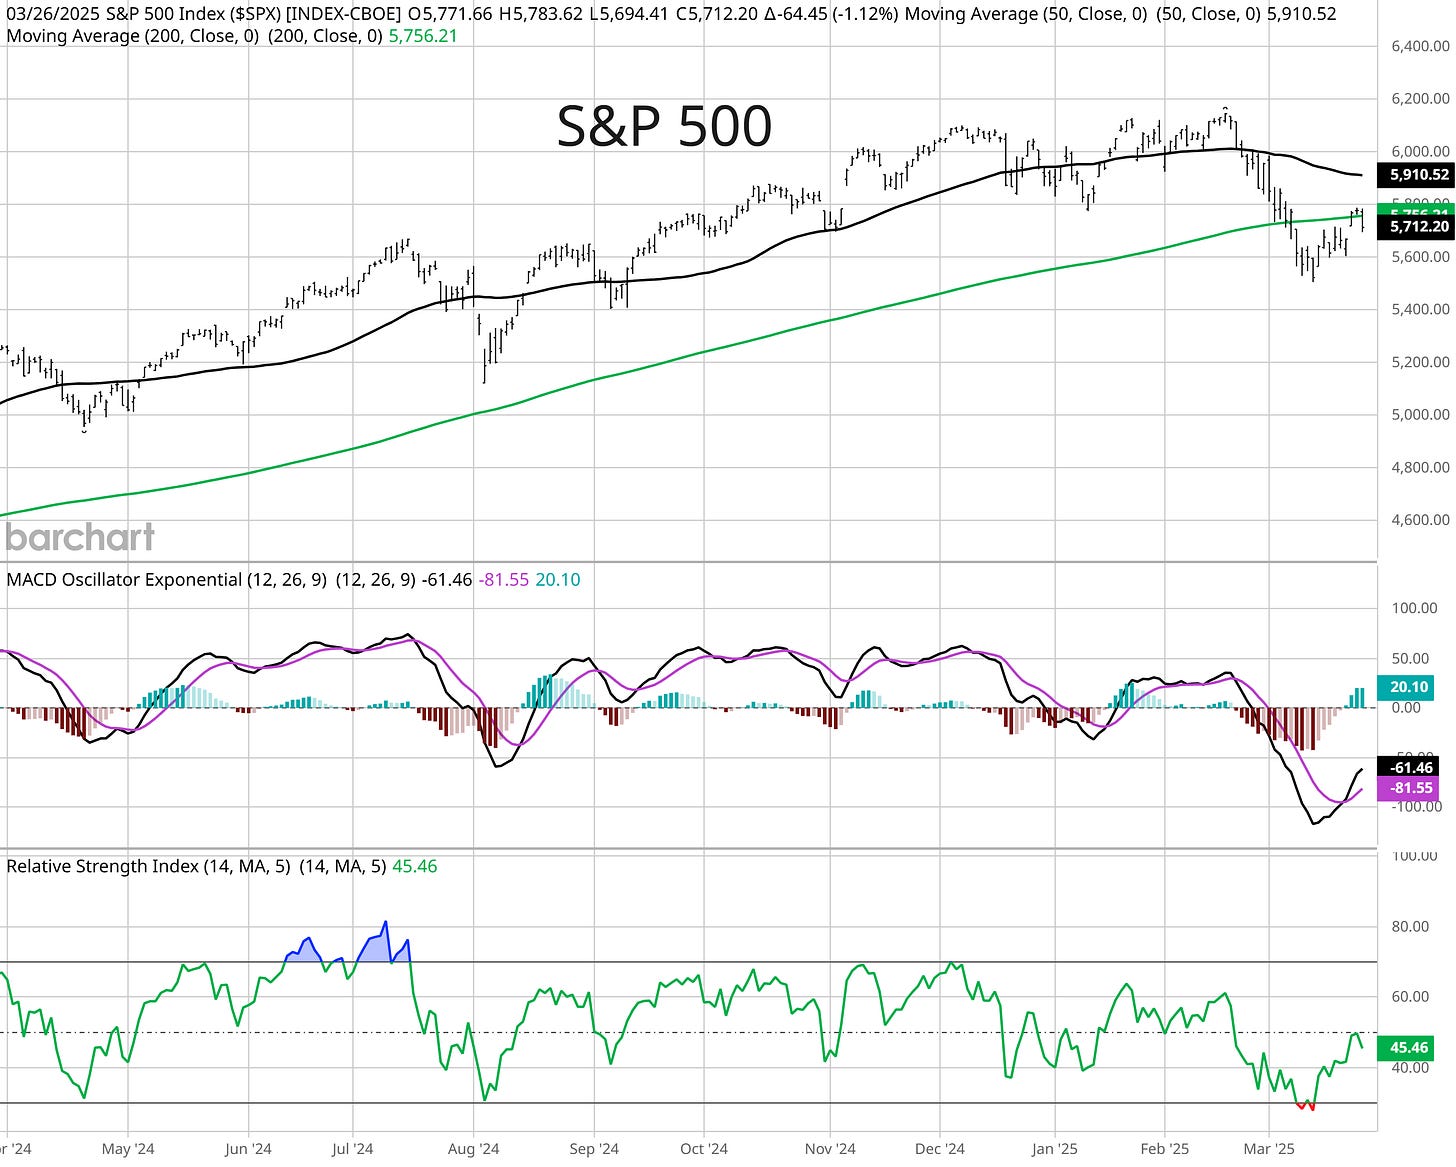
Conflicting evidence around the health of the U.S. economy is keeping investors on their toes. Following a 10% correction in the S&P 500, the forward path and probability for a recovery comes down to a recession and the outlook for the earnings picture. The S&P 500 is also struggling for traction at a key level. The recent correction took the S&P 500 below the 200-day moving average (MA) for the first time since late 2023 as you can see in the chart below. The gap higher to start the week brought the S&P just above the 200-day MA (green line), but was subsequently rejected. Price may ultimately fill the gap from Monday’s price action, but the 200-day is a key resistance level to watch in the days ahead as the MACD and RSI are both making bearish momentum resets (MACD is below the zero line and RSI under 50).
While the S&P 500 is struggling for traction, a large portion of the weakness is attributed to Mag 7 stocks. That’s masking pockets of strength seen in the average stock and in other market sectors. I’m keeping a close eye on the action happening in the energy sector, where several new setups are unfolding that are showing relative strength and trading just below 52-week highs (chart setups discussed below and in the chat). As a catalyst for the sector, it’s worth noting that bearish investor positioning could boost oil prices. That’s because Commodity Trading Advisors (CTAs) have built the largest short position in oil since 2014 (chart below).
Keep reading to see:
Open ETF positions.
Open stock positions.
Chart analysis for new trade ideas.


