In this post, I’ll focus on setups that I’m monitoring for both long and short positions. With a chart and short write-up, this is a quick way to scan and plan potential trades.
These ideas are the end result of my process to identify stocks offering the right combination of growth fundamentals along with a proper chart setup.
Here are my notes from a focus list of setups I’m monitoring.
📢Before jumping into today’s chart report, I’m preparing to launch a new premium feature:
Mosaic Traders Hub
The Hub goes live on 10/28, and you can read all the details of what’s included here (plus several new features).
If you enjoy Mosaic Chart Alerts, then you’re going to love the Hub! You can reserve your spot by pledging today.
Stock Market Update
Lagging participation and excessive bullish sentiment might be finally catching up to the S&P 500. Mid-October registered several signals that investor optimism was running too hot. That included CNN’s Fear & Greed Index pushing near “extreme greed” territory while the equity put/call ratio recently registered the lowest reading since July 2023. Sentiment on its own is not much of a concern, except for when negative breadth divergences start showing up. The percent of stocks trading above their 20-day moving average is back below 50% while the McClellan Oscillator (that I covered here) is dropping back into negative territory. The chart below of the S&P 500 also shows a small momentum divergence developed with the RSI in the bottom panel while the MACD was extended to the upside.
A combination of bullish sentiment, deteriorating breadth, and mean-reversion lower from strong gains since mid-September are the right ingredients to see a pullback heading into the elections. But it’s hard to get too worked up over yesterday’s 0.92% drop in the S&P 500. If a larger drawdown is on the way, then I would keep an eye on a volatility measure using the CBOE Volatility Index (VIX). More specifically, the volatility of VIX (also referred to as VVIX) is giving us a chart pattern to watch below. Since early September, VVIX is creating a triangle pattern with resistance at the 120 level. If VVIX jumps over that level, that could drag the VIX higher and lead volatility targeting strategies to reduce equity exposure and place further selling pressure on stocks.
Vol levels tend to spike into the election based on historical precedent, so a pullback should not come as a surprise. But at this point I would view any drop in the S&P 500 as a pause in the broader bull market trend. As I covered in this week’s Market Mosaic, economic activity is set to receive another boost by a global central bank easing cycle. That should be a positive backdrop for corporate earnings, which should be good for stock prices. For this week, I’m removing OPXS and TSM as each stock breaks out to complete the chart pattern. I’m also removing OSCR as the stock pulls back further and invalidates its chart setup. That clears the way for new additions to the watchlist.
Keep reading below for all the updates…
Long Trade Setups
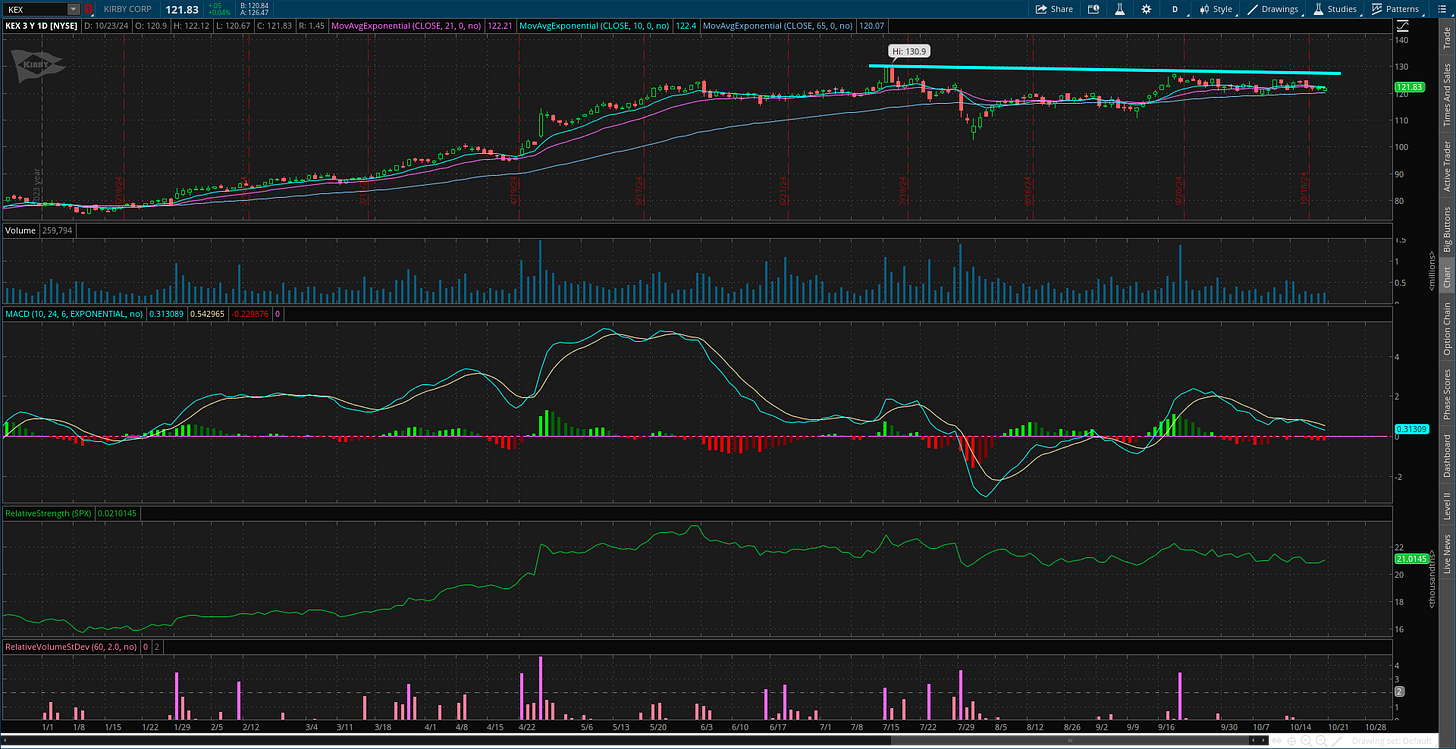
KEX
Peaked near the $125 level back in June and consolidating gains since then. Recent smaller pullback since September is trading in a tight range as the MACD resets at the zero line. Watching for a move over $128.
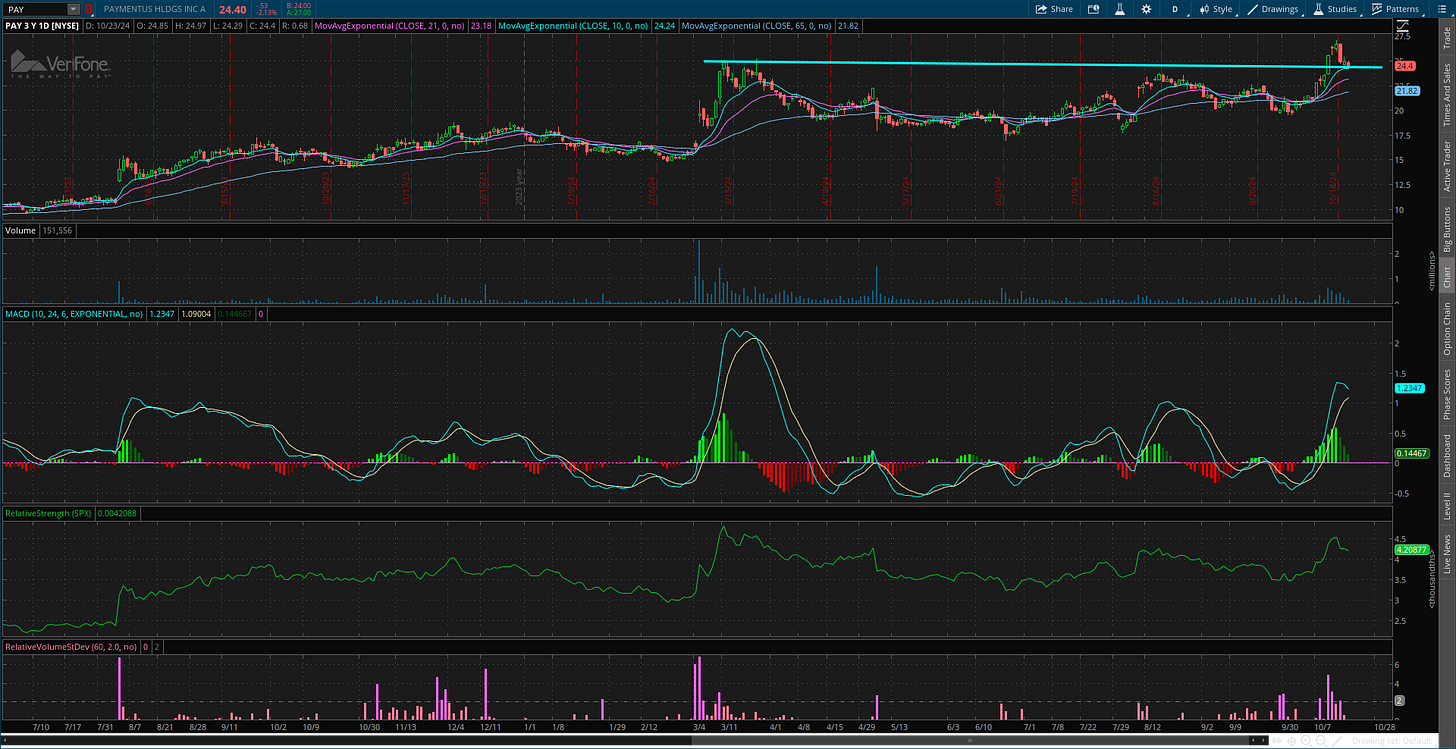
PAY
Tested $25 back in March then created a new base. Price broke above $25 last week following a smaller pullback. The stock is back testing the breakout level. I’m watching for a MACD reset at zero then a move above $27.
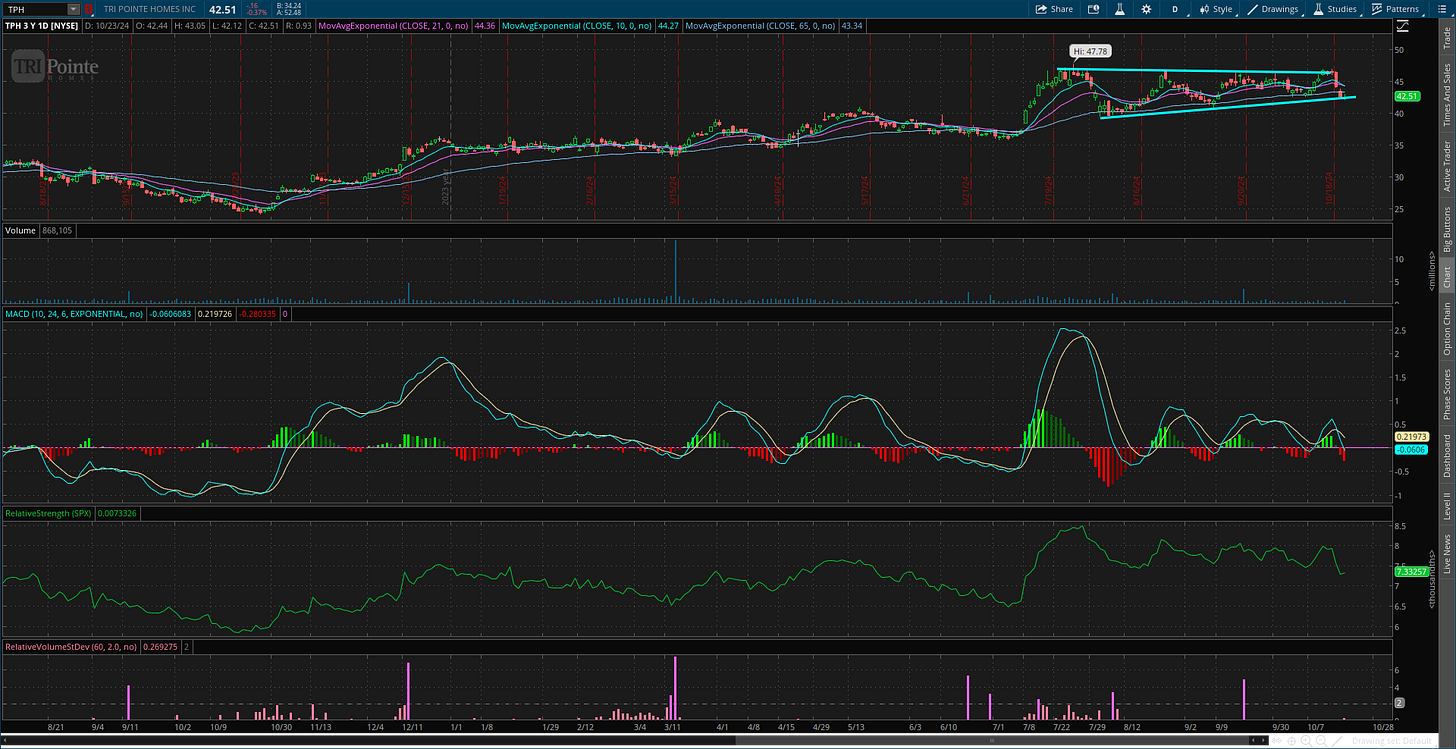
TPH
After rallying to the $47 level in July, the stock has been consolidating gains. Recent series of smaller pullbacks off the $47 resistance level, while the relative strength (RS) line is holding near the high. I’m watching for a breakout over $47 on higher volume with confirmation by the RS line.
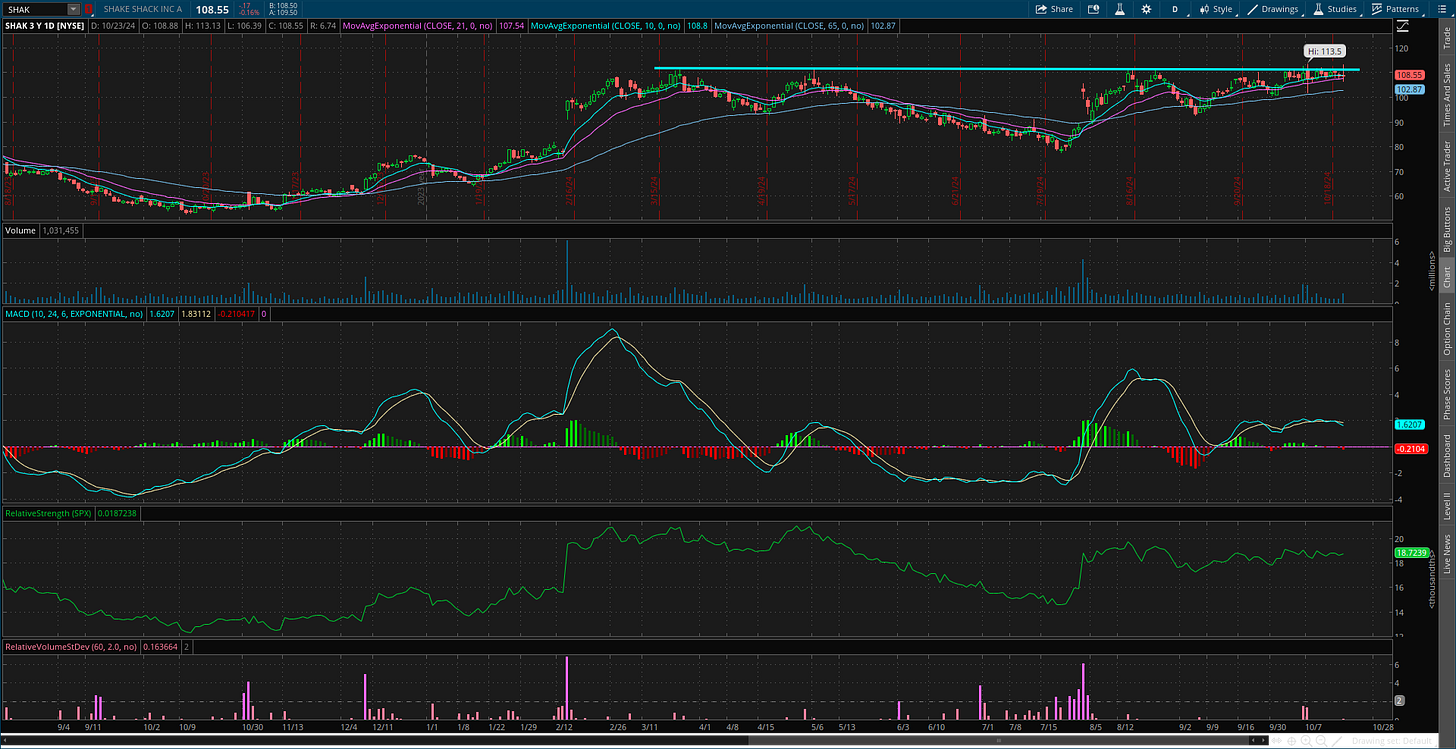
SHAK
Peaked at the $110 level back March, and creating a new basing pattern since then. Starting to make a series of higher lows following the pullback into July, with a recent MACD reset at zero just below price resistance. Watching for a move over $110.
WING
Peaked around $430 back in June, and recently retesting that level again. Need to see price action firm up with the MACD back above zero. And price should not drop below $360 in the pattern. Looking for confirmation by the RS line on a move over $430.
CCS
Keeping on watch but following a new pattern. After moving over the $90 level, the stock is back testing that area as support while creating a new basing pattern. Making a series of higher lows with resistance at $108. Watching for a breakout over that level.
FG
Broke out of a base back in November and rallied to the $48 area. Consolidating gains since the start of the year and recently rallying back toward $48. Want to see price hold support at the $35 level on any pullback.
Short Trade Setups
F
Rallying off a test of support at the $10 level. That reset the MACD below the zero line, while the RS line has stayed near the lows. Price now making a bearish flag pattern, with support at the $10.60 area. Watching for a break below the flag with confirmation by the RS line at new lows.
Rules of the Game
I trade chart breakouts based on the daily chart for long positions. And for price triggers on long setups, I tend to wait until the last half hour of trading to add a position. I find that emotional money trades the open, and smart money trades the close. If it looks like a stock is breaking out, I don’t want a “head fake” in the morning followed by a pullback later in the day.
I also use the RS line as a breakout filter. I find this improves the quality of the price signal and helps prevent false breakouts. So if price is moving out of a chart pattern, I want to see the RS line (the green line in the bottom panel of my charts) at new 52-week highs. Conversely, I prefer an RS line making new 52-week lows for short setups.
Also for long positions, I use the 21-day exponential moving average (EMA) as a stop. If in the last half hour of trading it looks like a position will close under the 21-day EMA, I’m usually selling whether it’s to take a loss or book a profit.
For short (or put) positions, I trade off a four-hour chart instead of a daily. Why? There’s a saying that stocks go up on an escalator and down on an elevator. Once a profitable trade starts to become oversold on the four-hour MACD, I start to take gains. Nothing like a short-covering rally to see your gains evaporate quickly, so I’m more proactive taking profits on short positions. I also use a 21-period EMA on the four-hour chart as a stop. If there is a close above the 21-period EMA, I tend to cover my short.
For updated charts, market analysis, and other trade ideas, give me a follow on X: @mosaicassetco
Disclaimer: these are not recommendations and just my thoughts and opinions…do your own due diligence! I may hold a position in the securities mentioned in this post.


