

Welcome back to Mosaic Chart Alerts!
In this post, I’ll focus on setups that I’m monitoring for both long and short positions. With a chart and short write-up, this is a quick way to scan and plan potential trades.
These ideas are the end result of my process to identify stocks offering the right combination of fundamentals along with a proper chart setup.
Here are my notes from a focus list of setups I’m monitoring.
Stock Market Update
Following yesterday’s Consumer Price Index (CPI), stocks are struggling with the reality that rate cuts by the Federal Reserve might be pushed back farther, and with fewer cuts happening in 2024 as well. The CPI report on consumer inflation showed the headline figure increasing 3.1% in January compared to last year, while the core measure gained 3.9%. Both measures were higher than expected, with the more recent 3- and 6-month annualized core figures inflecting higher (chart below). That comes on the heels of a strong jobs report and messaging from the Fed that investors got ahead of themselves expecting a rate cut as soon as March. Market-implied odds for the first rate cut are now pushed out to June, while the 10-year Treasury yield has increased to 4.26% versus 3.86% just two weeks ago.

The S&P 500 ended the day down 1.4%, but it’s the action in small-caps that I’m following most closely. As I noted in this week’s Market Mosaic, there were positives developing with the IWM exchanged-traded fund (ETF) that tracks the Russell 2000 Index of small-cap stocks. A key resistance area was being tested again, where a breakout could significantly help alleviate the recent weakness in market breadth. But small-caps were hit hard on the changing rate outlook, with IWM dropping nearly 4% on the day. The chart below shows the IWO small-cap growth ETF, which has a similar pattern to IWM. Growth stocks are particularly sensitive to the rate outlook, but IWO is still holding above moving average support even with yesterday’s pullback.

My trading strategy for this market environment remains the same. I will take breakouts that are meeting my criteria, but will not hesitate to honor my hard or trailing stops using exponential moving averages (EMA). It’s easy to get caught up in the headlines and daily volatility. But if a position is holding above key short-term moving averages like the 9- and 21-day EMA, then the trend is still intact in my opinion. For me, using trailing moving averages removes a lot of the stress and guesswork on when to sell, while allowing me to ride the trend. For this week, I’m removing AAON from the watchlist as the stocks breaks out to complete its pattern. I’m also removing RCL as the stock trades below an important support level in its chart setup.
Keep reading below for all the updates…
Long Trade Setups
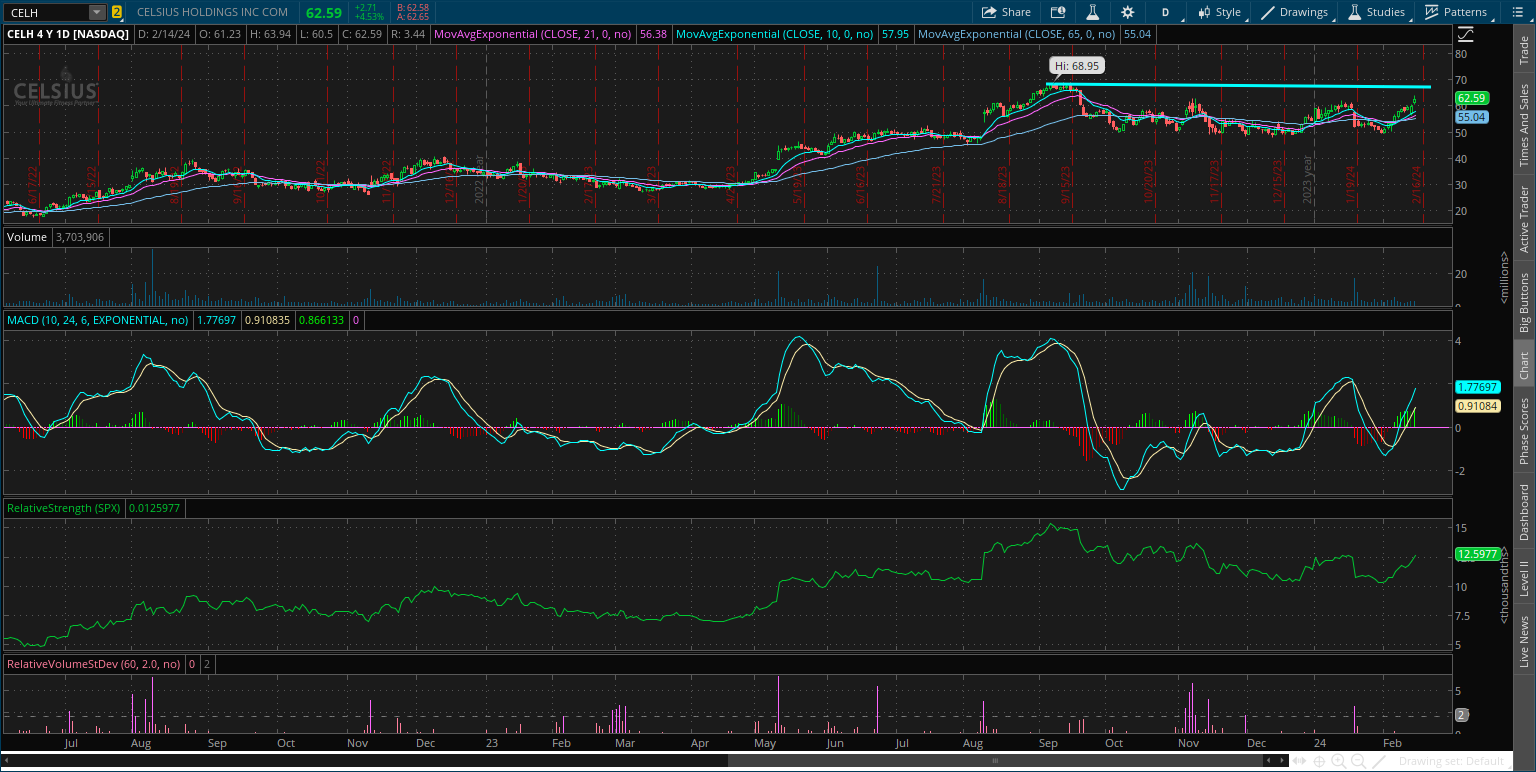
CELH
Stock consolidating since early September following a run to new highs. Initial resistance at the $63 level, but would like to see the MACD reset at zero before attempting a breakout over $70.
PATH
Attempting to emerge from a bottoming base going back nearly two years. Stock basing since December after breaking out over the $20 level. Now watching for a move over $27.

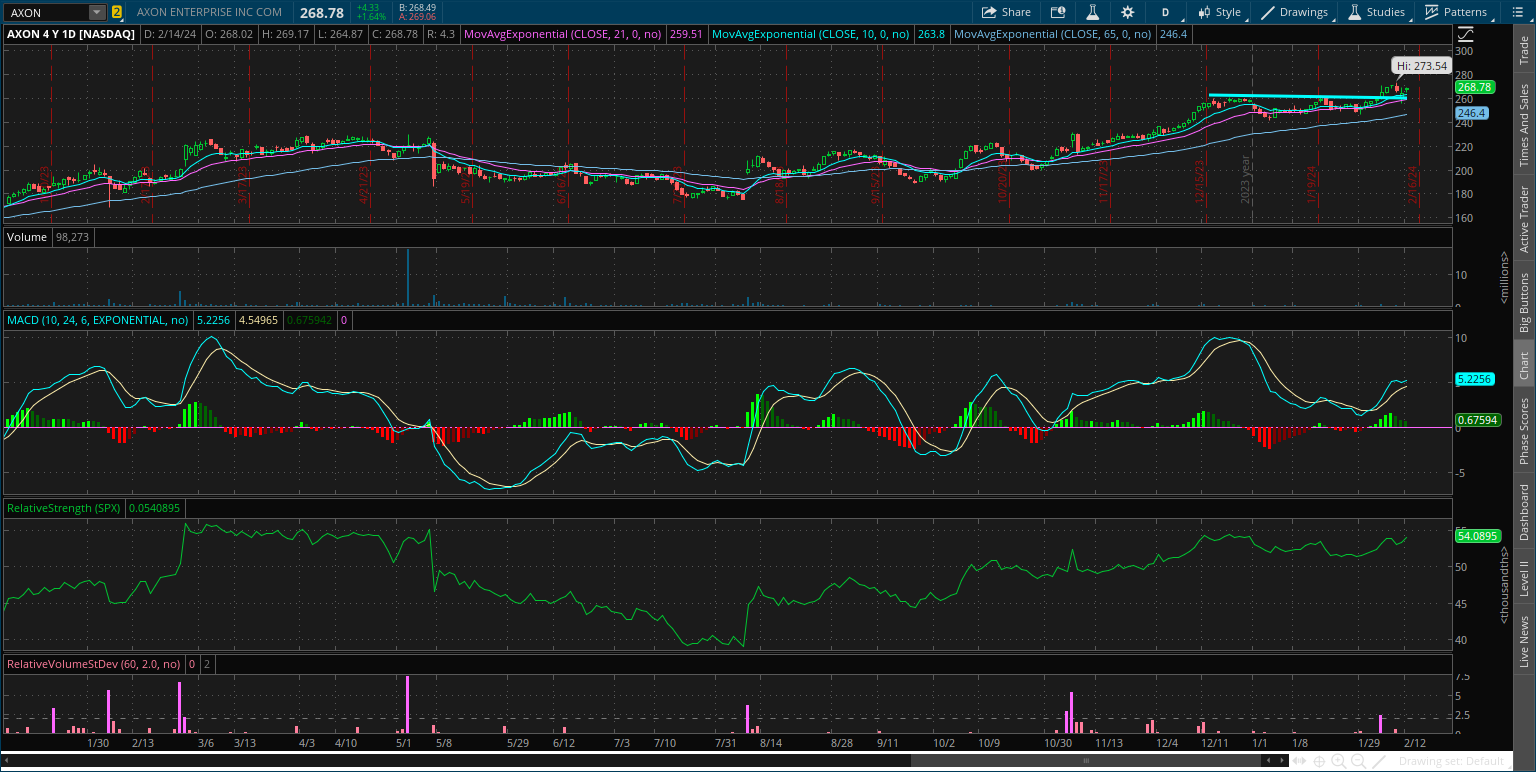
AXON
Created a saucer-like basing pattern from March to December last year. Broke out over resistance at $230 and went back to test that level. The MACD has reset with the relative strength (RS) line holding near the high. Recently moving over new resistance at $260.
STNE
Starting to emerge from a bottoming base going back two years. Took out resistance at $15 and now consolidating the gains. Trading sideways since late December, with a new resistance level near the $19 level.

ERJ
Recently testing the $20 level, which is resistance from 2021. Pulling back from that level while also finding support near the $16.50 area along with a MACD reset. Watching for a move over $20 with confirmation from the RS line.

IOT
Consolidating gains since the start of December after the breakout to new highs over the $30 level. The RS line has weakened more than ideal, but support at the $30 level is being respected. Looking a move to new highs over $35.

BX
Since peaking back in 2021, the chart has the appearance of a large saucer-type pattern. Price recently nearing the prior high at $140 and now pulling back. That’s resetting the MACD while price holds support at $115. Watching for a move to new highs over $140.

APP
Trading in a range since September with resistance at the $45 level. The MACD making higher lows on each pullback in that range. Recent false breakout, which was not confirmed by the RS line (a great example of how I filter on RS). Need to see the RS line strengthen on a breakout attempt.

GES
Keeping on the watchlist for now as long as support at $20 holds. Still watching resistance at $24, which is a level tested several times going back to 2021. Series of higher lows since last October’s bottom. A breakout could target the prior high near $29.

Short Trade Setups
None this week!
Rules of the Game
I trade chart breakouts based on the daily chart for long positions. And for price triggers on long setups, I tend to wait until the last half hour of trading to add a position. I find that emotional money trades the open, and smart money trades the close. If it looks like a stock is breaking out, I don’t want a “head fake” in the morning followed by a pullback later in the day.
I also use the RS line as a breakout filter. I find this improves the quality of the price signal and helps prevent false breakouts. So if price is moving out of a chart pattern, I want to see the RS line (the green line in the bottom panel of my charts) at new 52-week highs. Conversely, I prefer an RS line making new 52-week lows for short setups.
Also for long positions, I use the 21-day exponential moving average (EMA) as a stop. If in the last half hour of trading it looks like a position will close under the 21-day EMA, I’m usually selling whether it’s to take a loss or book a profit.
For short (or put) positions, I trade off a four-hour chart instead of a daily. Why? There’s a saying that stocks go up on an escalator and down on an elevator. Once a profitable trade starts to become oversold on the four-hour MACD, I start to take gains. Nothing like a short-covering rally to see your gains evaporate quickly, so I’m more proactive taking profits on short positions. I also use a 21-period EMA on the four-hour chart as a stop. If there is a close above the 21-period EMA, I tend to cover my short.
For updated charts, market analysis, and other trade ideas, give me a follow on X: @mosaicassetco
Disclaimer: these are not recommendations and just my thoughts and opinions…do your own due diligence! I may hold a position in the securities mentioned in this post.
great callout on CELH! I’ve been bullish on CELH for a week or two now