

In this post, I’ll focus on setups that I’m monitoring for both long and short positions. With a chart and short write-up, this is a quick way to scan and plan potential trades.
These ideas are the end result of my process to identify stocks offering the right combination of growth fundamentals along with a proper chart setup. Live alerts are sent to Traders Hub members only.
Stock Market Update
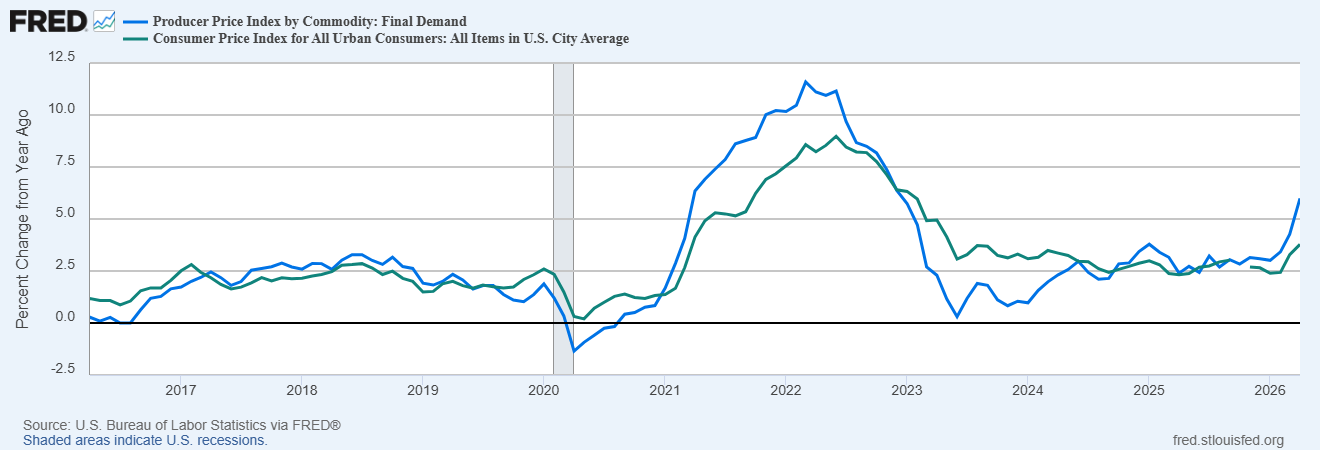
Investors are shrugging off a pair of hotter than expected inflation reports and pushing major indexes to fresh record highs. Headline producer and consumer inflation is surging higher, reflecting the jump in energy prices following the war in the Middle East. The Consumer Price Index (CPI) increased by 3.8% in April compared to last year, which is the largest gain in nearly three years. The Producer Price Index (PPI)), which tends to lead changes in the CPI, increased by 6.0% in April and was the largest gain since the end of 2022. The chart below plots the year-over-year change in CPI (green line) and PPI (blue line) for the past 10 years.
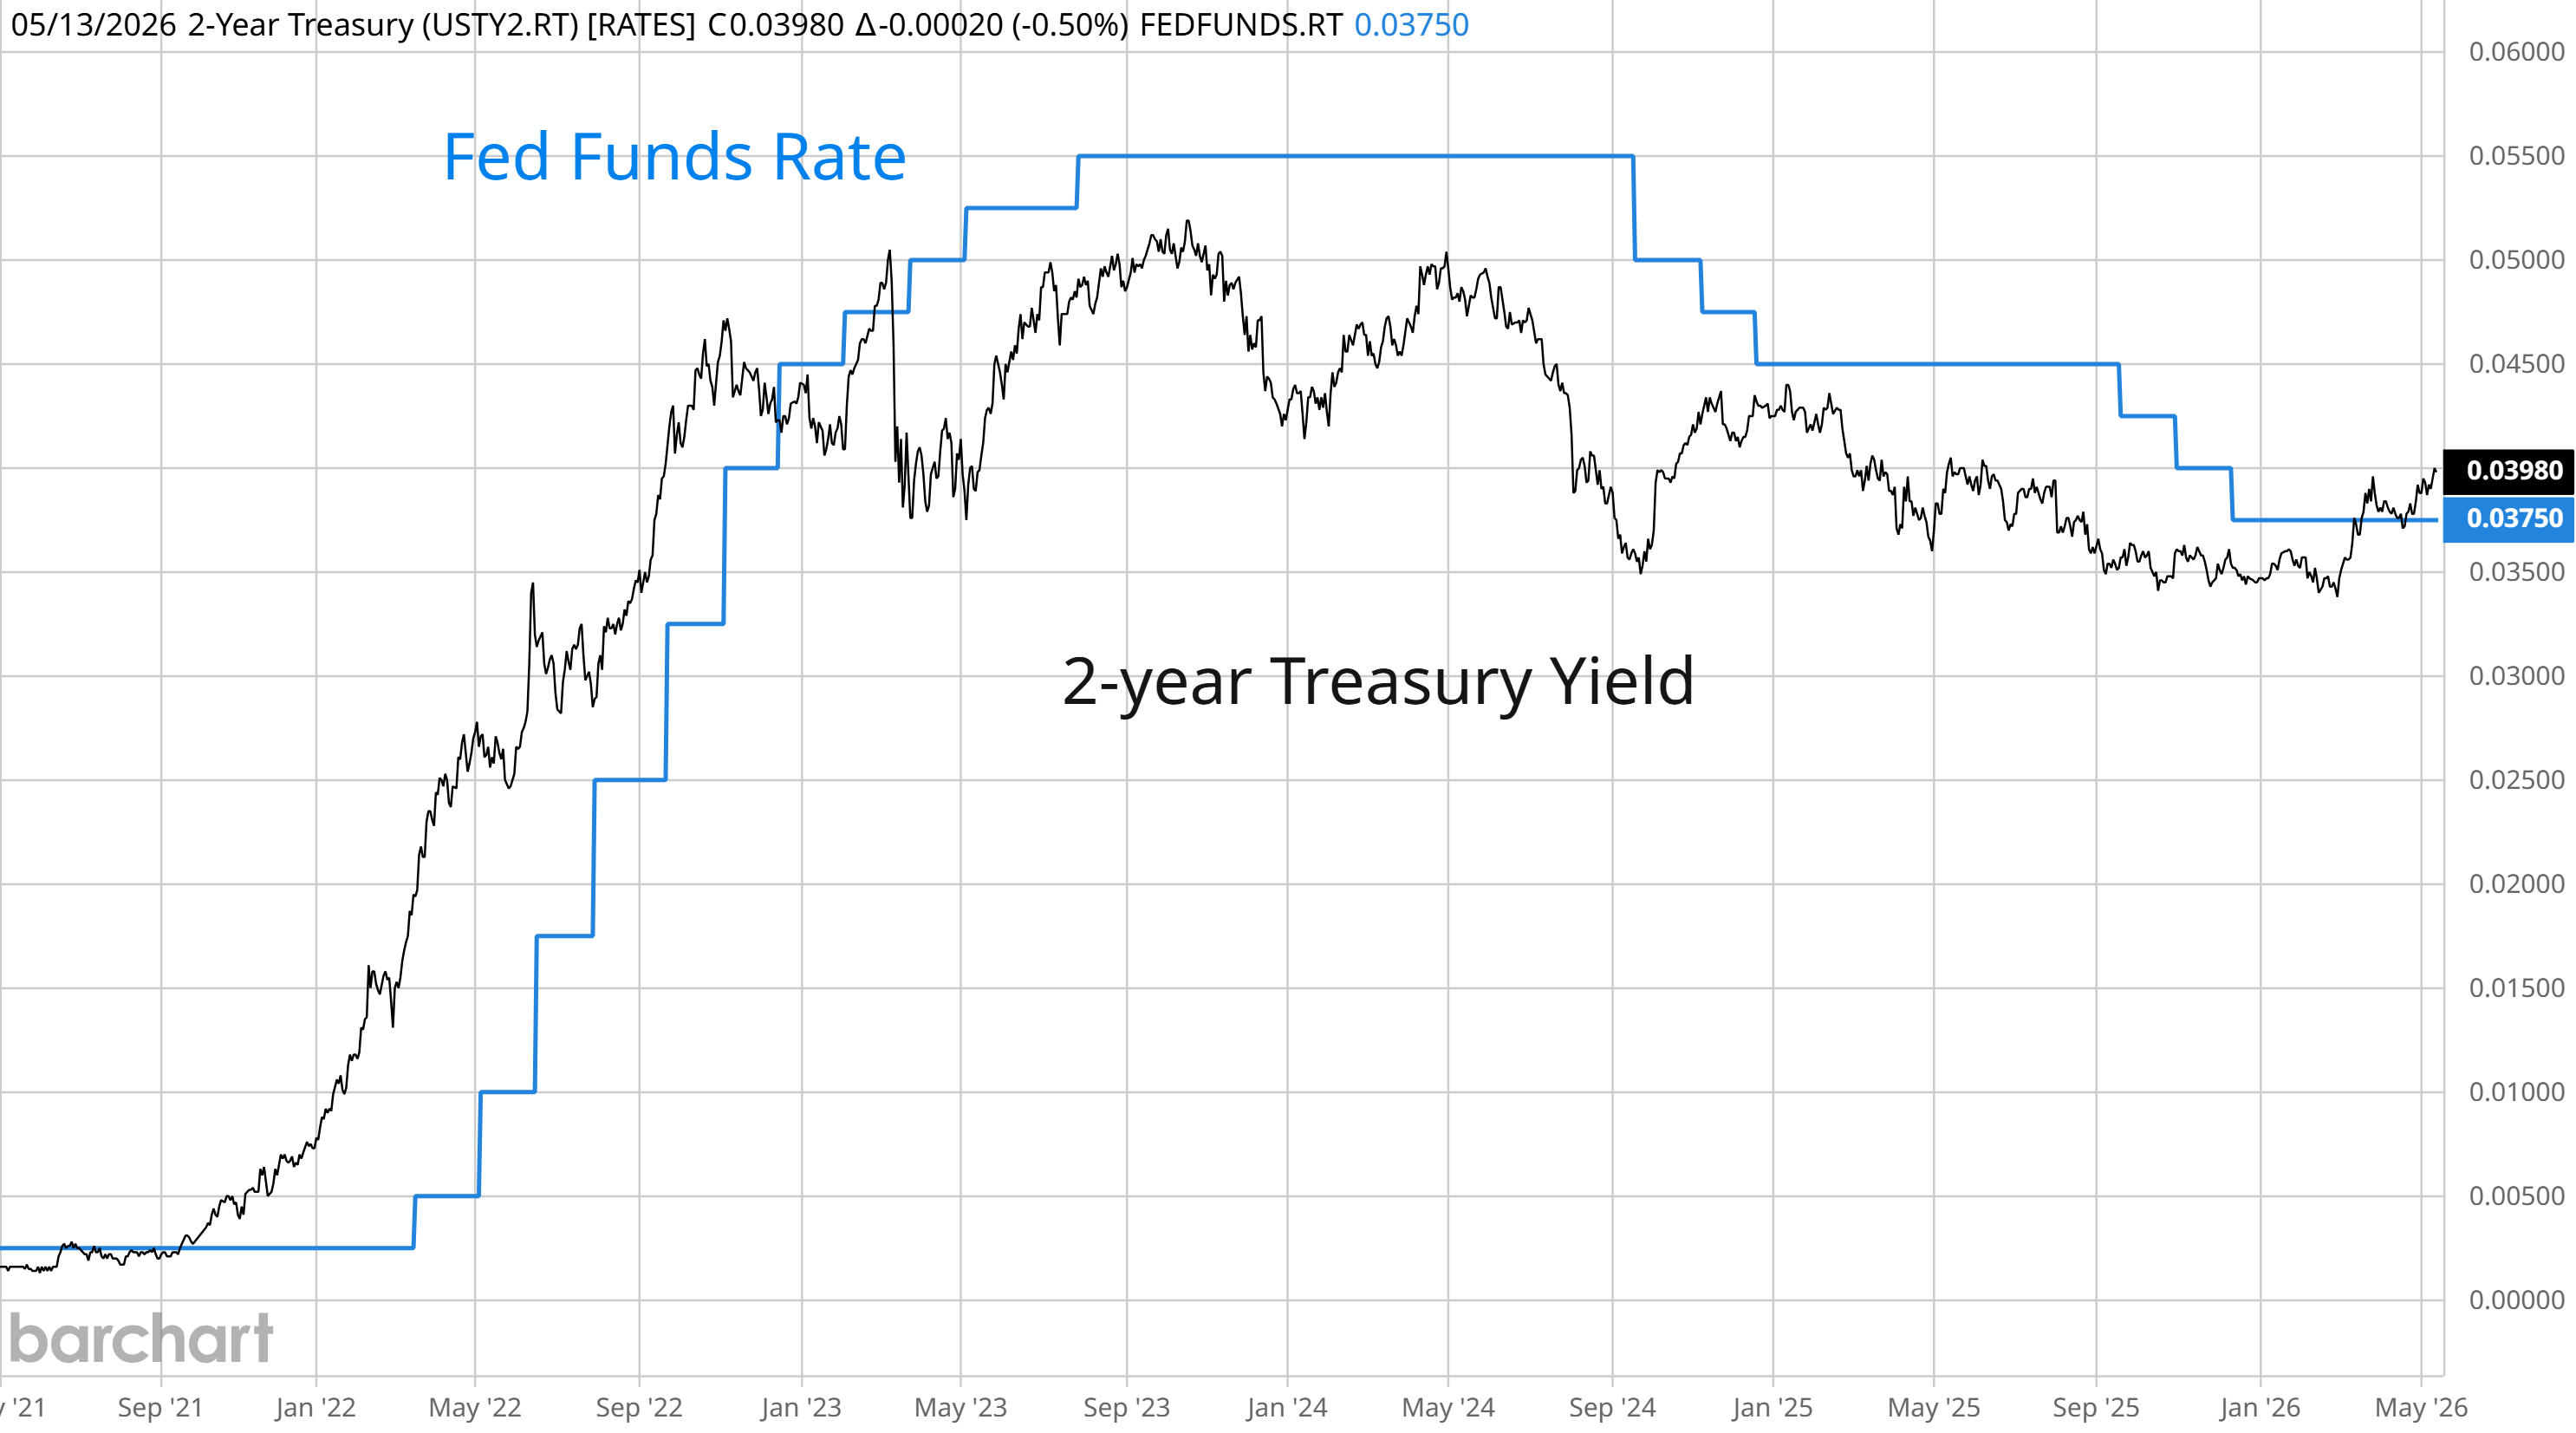
The prospect for another inflation wave is lining up with similarities to the surge in price levels into mid-2022. Disrupted supply chains from last year’s trade war, impact of war on energy markets, and stimulus via large federal budget deficits are coming together at the same time. That’s throwing the outlook for interest rates into question, where market-implied odds are now increasingly pricing rate hikes in the year ahead. At the same time, the 2-year Treasury yield that leads the short-term fed funds rate is at the highest level in a year and well above the Fed’s current upper target for fed funds (chart below). The bond market is signaling a pending shift in monetary policy at a time when central bank hawkishness is already on the rise.
The jump in inflation and shifting outlook for monetary policy isn’t slowing the rally. The S&P 500 continues surging higher and is currently up 18% from the late March low. One growing issue is that participation in the trend is lagging more recently, with just 44% of stocks across major exchanges trading above their 20-day moving average. While deteriorating breadth is a condition to monitor, we’ll keep trailing open positions utilizing moving averages and taking gains into strength. Keep reading to see:
Open ETF positions.
Open stock positions.
Chart analysis for new trade ideas.
