

In this post, I’ll focus on setups that I’m monitoring for both long and short positions. With a chart and short write-up, this is a quick way to scan and plan potential trades.
These ideas are the end result of my process to identify stocks offering the right combination of growth fundamentals along with a proper chart setup.
Stock Market Update
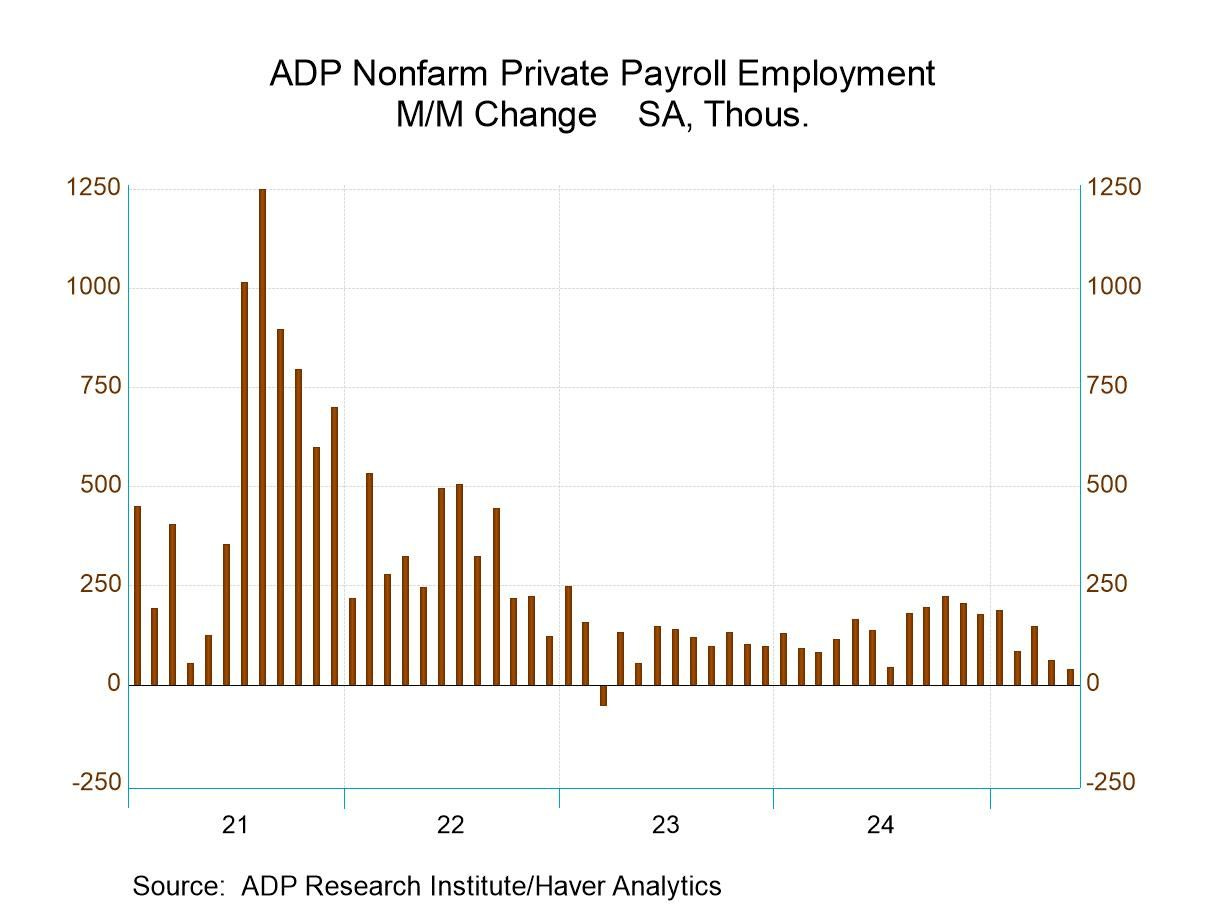
A batch of weaker than expected reports covering the manufacturing sector and labor market sets up a highly anticipated May payrolls report. The ISM manufacturing PMI was reported at 48.5 for May, which came in below expectations. The report is structured so that a reading above 50 indicates expansion while under 50 points to contracting activity. Within the report, the imports component sank to 39.9 which was the lowest level since 2009. The leading new orders component was reported at 47.6, while the employment measure came in at 46.8. Meanwhile, the ADP report on private sector payrolls showed just 37,000 jobs were created for the month of May (chart below). It was the lowest monthly job total since March 2023.
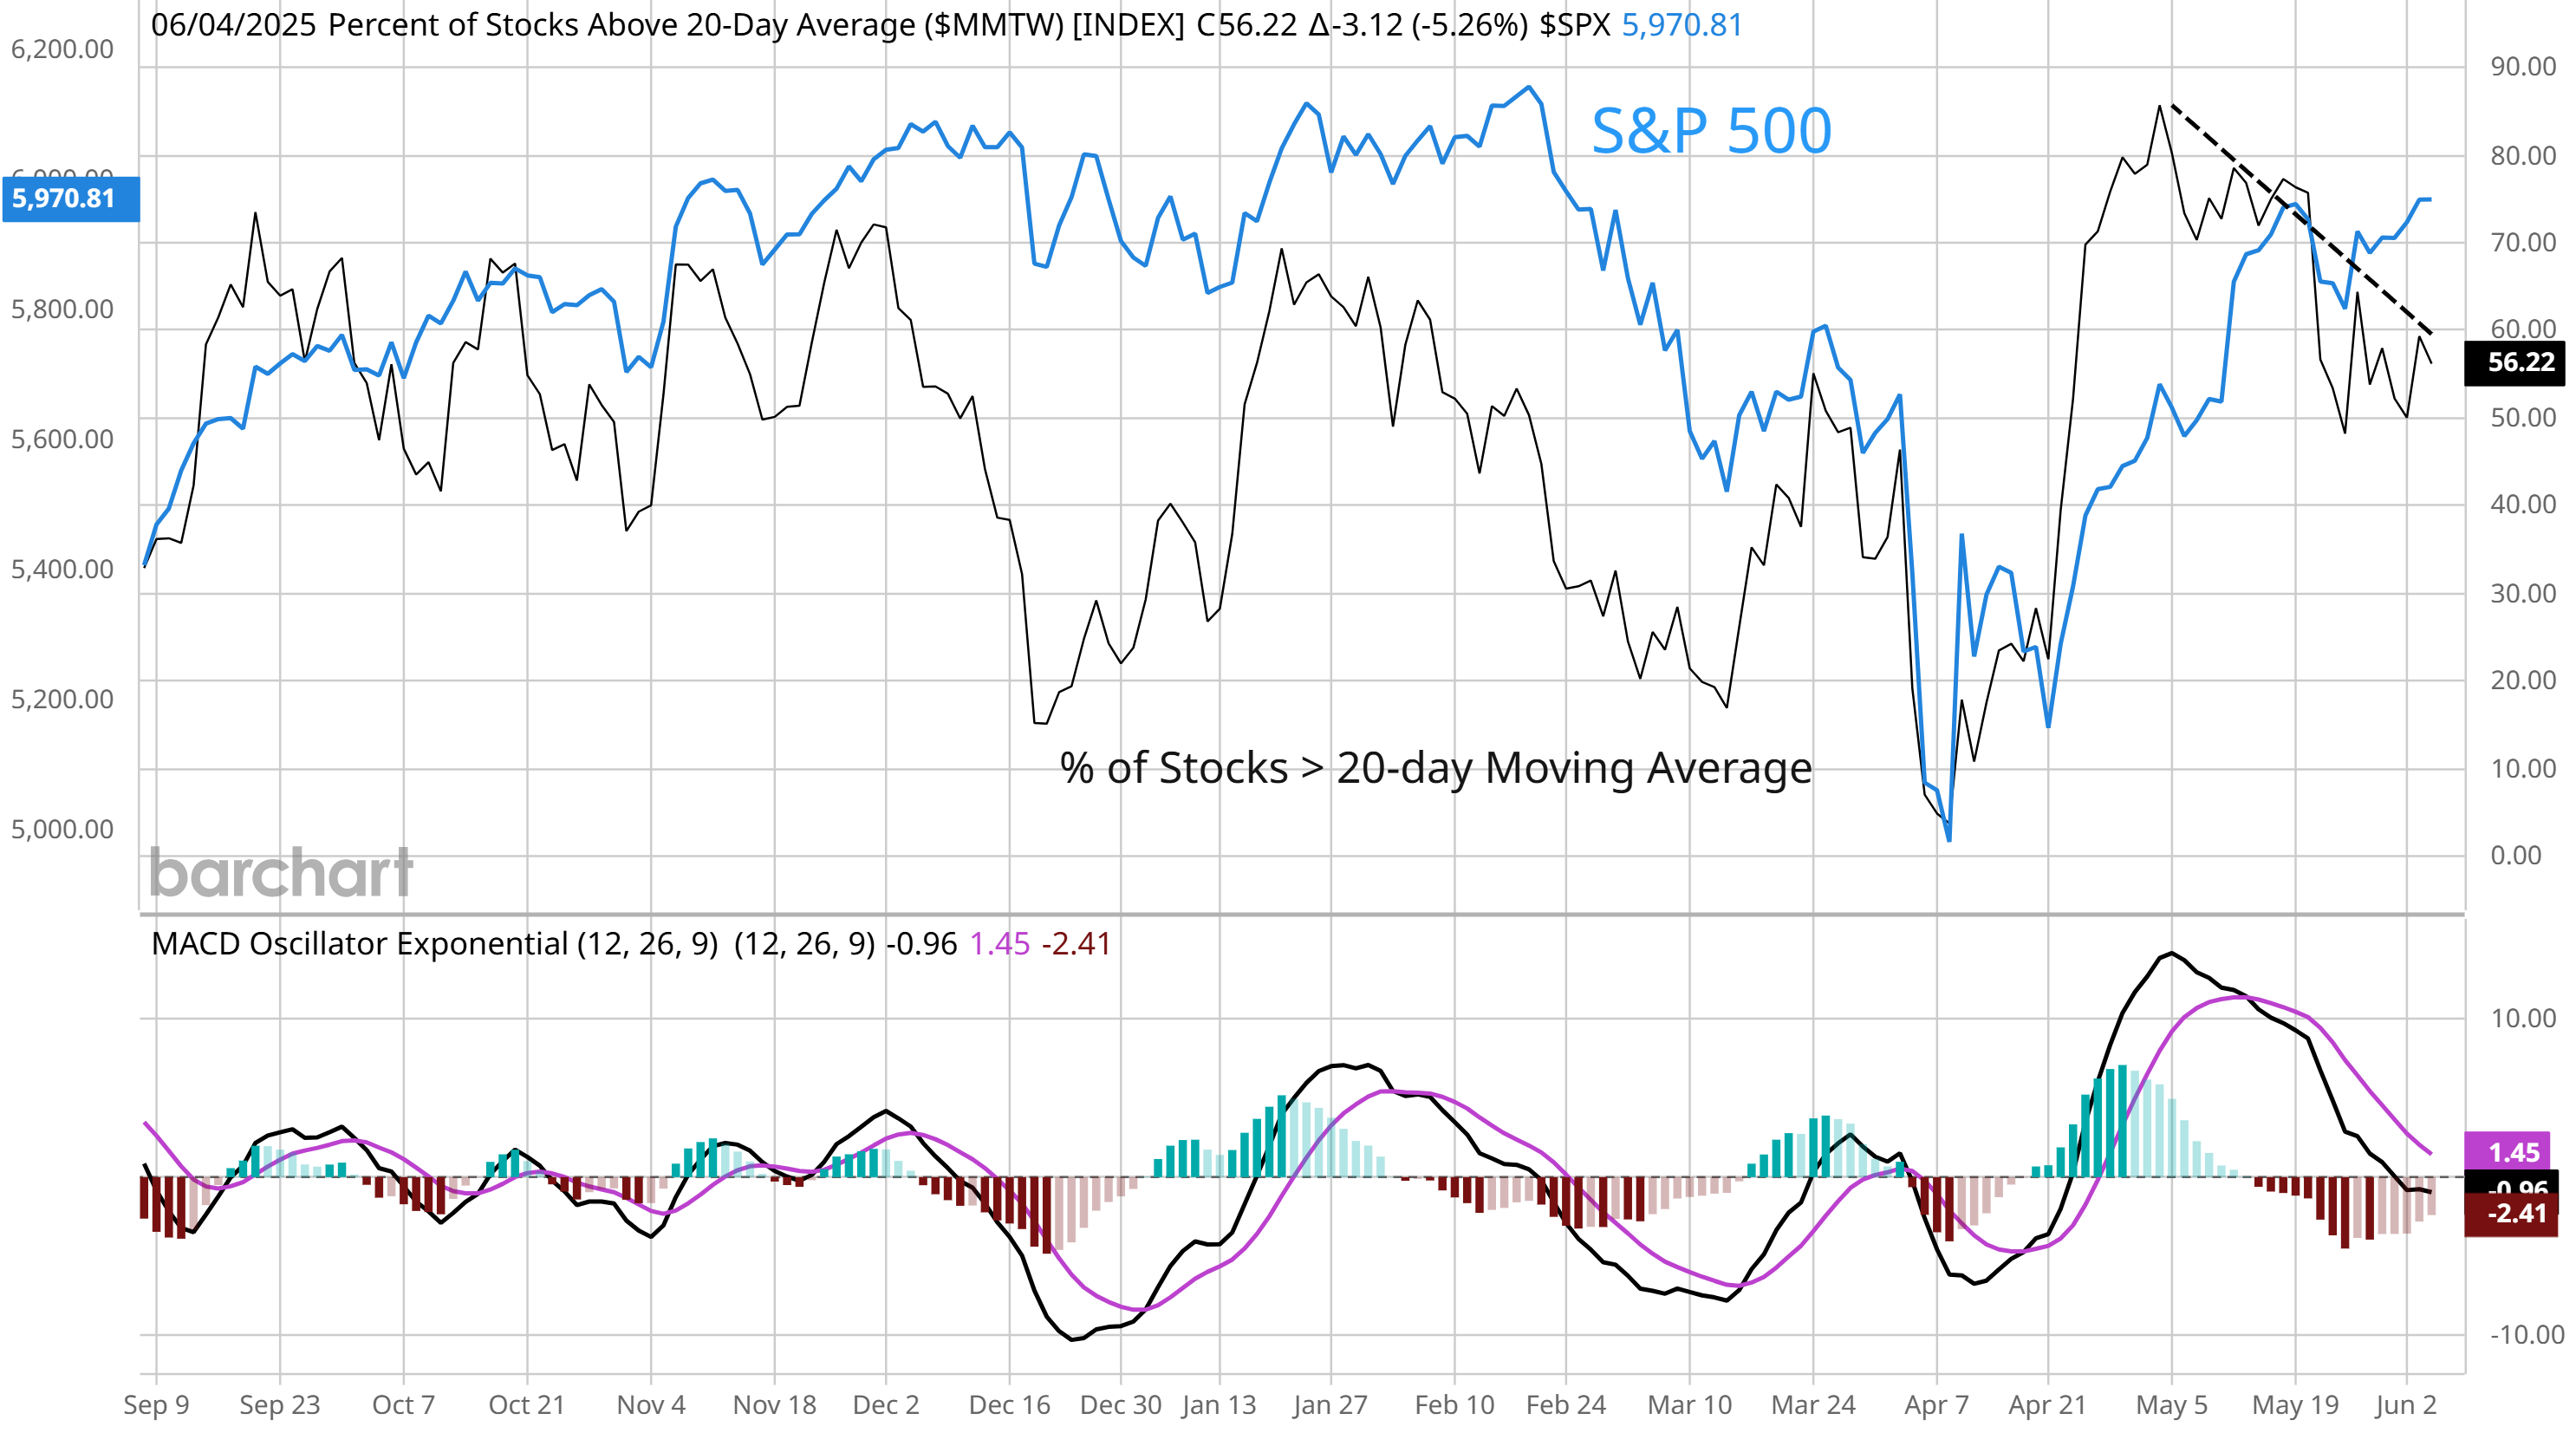
The reports suggest that the uncertainty created by tariffs and the trade war are starting to show up in both soft and hard economic data. At the same time, there are negative divergences appearing in the stock market. As the S&P 500 trades within 3% of the prior all-time high, the average stock across the market is lagging further. The chart below shows the percent of stocks across major exchanges trading above their 20-day moving average (MA). That’s a way of gauging how many stocks are in short-term uptrends. You can see that figure has dropped from 85% in early May to 56% currently even as the S&P 500 has continued its uptrend.
Along with a recent shift in several investor sentiment surveys back to levels showing too much greed, negative conditions are warning on the near-term outlook. A broader pullback in market could help alleviate excessive momentum following the rally off the April lows, and help with several bullish chart setups that we’re monitoring. Keep reading to see:
Open ETF positions.
Open stock positions.
Chart analysis for new trade ideas.
