
Mosaic Chart Alerts
Can bearish sentiment and oversold conditions deliver a rally?

Welcome back to Mosaic Chart Alerts!
In this post, I’ll focus on setups that I’m monitoring for both long and short positions. With a chart and short write-up, this is a quick way to scan and plan potential trades.
These ideas are the end result of my process to identify stocks offering the right combination of fundamentals along with a proper chart setup.
Here are my notes from a focus list of setups I’m monitoring.
Stock Market Update
Evidence of reaccelerating inflation and an uncertain outlook for interest rate cuts by the Federal Reserve are reverberating across the capital markets. Market-implied odds favor no cuts to the fed funds rate until the September meeting, while Treasury yields on both short- and long-term maturities are jumping higher. The 10-year Treasury recently touched 4.65% after starting the year at 3.86%, while the 2-year yield (that can lead changes in the fed funds rate) is hovering just below 5.0% compared to 4.23% at the beginning of the year. The prospect of tighter monetary policy and interest rate pressure on stock market valuations continues to be felt. The S&P 500 is moving below the 50-day moving average (MA - black line) over the past week and is close to filling the gap higher from late February. Beyond that, there isn’t much price support before the 200-day MA (green line) and January’s breakout to new all-time highs over the 4800 level.

While the S&P 500 is still holding its breakout to new highs in January, small-caps are looking like a failed breakout over an important resistance level. Back in March, small-caps started breaking out from a resistance range that’s held since early 2022 as you can see in the chart below of the IWM exchange-traded fund that tracks the Russell 2000 Index of small-cap stocks. But over the past week, IWM has pulled back below that range and is now testing another important support level around the $195 area. There’s also the rising 200-day MA (green line), while the RSI in the bottom panel is nearing oversold territory.

The pullback in the Russell 2000 is more reflective of the average stock, and several measures of breadth are hitting extremely oversold levels. That includes the percent of stocks trading above their 20-day moving average across the market, which now stands at just 14% and is the lowest since March 2023. I also highlighted the McClellan Oscillator here, and is near multi-year lows. Along with CNN’s Fear & Greed Index now firmly into “fear” territory, the sharp increase in bearish sentiment and oversold breadth means that conditions are evolving that can support a rally. But for right now, the poor price action across the market means activity on the watchlist has been quiet more recently. In addition, several stocks are moving below key support levels which is invalidating their chart setup. That includes DUOL, CUBI, and STNE so those names are coming off the list. I have a couple new additions showing better relative strength.
Keep reading below for all the updates…
Long Trade Setups
DDOG
Maintaining a series of higher lows since last April, and now trading sideways for the past three months. The relative strength (RS) line holding near 52-week highs, while the MACD recently crossed back above the zero line. Watching for a move over $137.

CRC
Oil and gas stock that’s consolidating since last September. Created a resistance level at $58, which was recently tested again. Would prefer to see the RS line strengthen further on any breakout attempt over $58.

ITRI
Gapped over $80 from a basing pattern going back to July. Trading in a tight range that held support above the breakaway gap, with a new resistance level around $100. Looking for a move over $100 with the RS line at a new 52-week high.

URA
Putting uranium miners back on the watchlist. The ETF recently testing resistance again at the $32 level, which is a key level going back to 2021. Would now like to see a MACD reset at the zero line followed by a breakout.

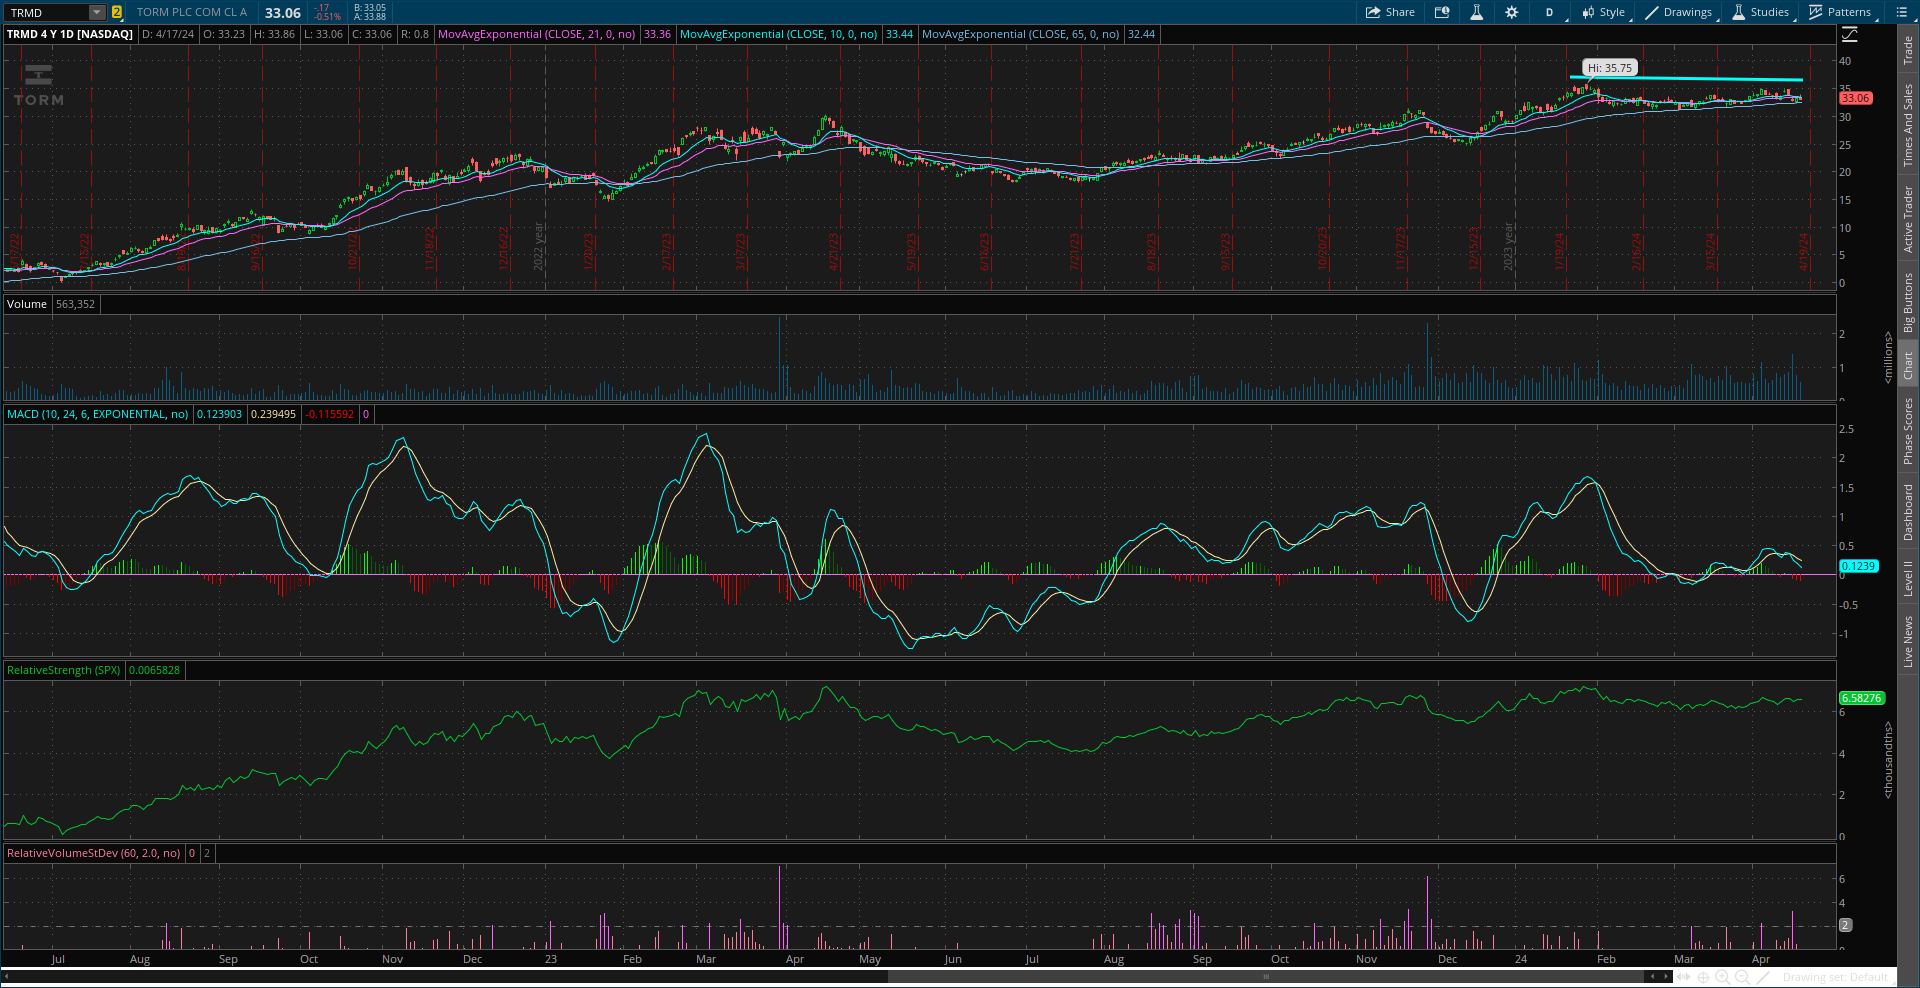
TRMD
Broke out over a prior resistance level at $32 and now back testing that level as support. The RS line is near the high while the MACD is trying to turn up from zero. Watching for a move over $37.
NET
Making a series of higher lows since last May as part of an overall bottoming base. Price recently filling a big gap from February, and holding that support level. Looking for a move over $105 followed by $110. Will keep on watch another week, but recent weakness may invalidate the pattern.

BX
Since peaking back in 2021, the chart has the appearance of a large saucer-type pattern. Price recently nearing the prior high at $140 and now pulling back. That’s resetting the MACD while price holds support at $115. Watching for a move to new highs over $140.

Short Trade Setups
None this week!
Rules of the Game
I trade chart breakouts based on the daily chart for long positions. And for price triggers on long setups, I tend to wait until the last half hour of trading to add a position. I find that emotional money trades the open, and smart money trades the close. If it looks like a stock is breaking out, I don’t want a “head fake” in the morning followed by a pullback later in the day.
I also use the RS line as a breakout filter. I find this improves the quality of the price signal and helps prevent false breakouts. So if price is moving out of a chart pattern, I want to see the RS line (the green line in the bottom panel of my charts) at new 52-week highs. Conversely, I prefer an RS line making new 52-week lows for short setups.
Also for long positions, I use the 21-day exponential moving average (EMA) as a stop. If in the last half hour of trading it looks like a position will close under the 21-day EMA, I’m usually selling whether it’s to take a loss or book a profit.
For short (or put) positions, I trade off a four-hour chart instead of a daily. Why? There’s a saying that stocks go up on an escalator and down on an elevator. Once a profitable trade starts to become oversold on the four-hour MACD, I start to take gains. Nothing like a short-covering rally to see your gains evaporate quickly, so I’m more proactive taking profits on short positions. I also use a 21-period EMA on the four-hour chart as a stop. If there is a close above the 21-period EMA, I tend to cover my short.
For updated charts, market analysis, and other trade ideas, give me a follow on X: @mosaicassetco
Disclaimer: these are not recommendations and just my thoughts and opinions…do your own due diligence! I may hold a position in the securities mentioned in this post.
WFC is on my buy list for Monday; 5 eMA crossed 14 MA on 4.17.24, MACD crossed signal line on 4.19.24 and is above the zero line, and RSI broke the 50% line on 4.16.24 and is overbought at 71 (my only concern). Price action has had higher opens since 4.16.24 on higher volume each day particularly the last two days, a buy signal. I am also looking at KDP and my only concern is that it's trading below the 200-day MA but is above the 50 and 150-day MA. Positive signs though include: higher opens and higher volume each day since 4.16.24.
Thanks again for this reply.
The focus is on major indices, price action, and key support and resistance levels. Is that where we should be looking ? Ii it time to step back and consider things like changes in the 10 year yield, 3 and 6 month inflation rates, and the money supply for direction to trade?